// BLOG
Visualize Your Akka.Streams Graphs with OpenTelemetry
Free, built-in OpenTelemetry tracing for Akka.Streams, new in Akka.NET v1.5.66
Register one OpenTelemetry source and your traces will show the real shape of your Akka.Streams graph: every stage, in the order it actually runs. No commercial license, no extra wiring. It’s built into Akka.NET as of v1.5.66.
People have been asking us for this since 2021. This post and its accompanying video walk through why it took so long, how we built it, and what it looks like running against a real production app.
Why This Was Hard
If you’ve watched any of our videos on Phobos, our commercial OpenTelemetry integration for Akka.NET, you know the way it works: Phobos injects itself into your actor system and instruments actor-to-actor communication. Actors that get instrumented carry tracing context back and forth through normal message passing. Phobos propagates that context automatically, comes with built-in dashboards, instruments Akka.Remote and Akka.Persistence, and has a lot of knobs to taper down the noise you’d otherwise drown in inside a busy actor system.
That model works great for ordinary actor messaging. It does not work for Akka.Streams.
The problem is that an Akka.Streams graph materializes into a swarm of actors that talk to each other using very low-level, circular-looking push and pull signaling. That’s how Akka.Streams achieves back pressure - downstream demand pulls, upstream supply pushes. Back in the early days of Phobos, before we stopped trying to trace Akka.Streams, naively instrumenting that machinery produced traces that were hundreds of thousands of spans long. That’s not useful to a DevOps team. An LLM would have a hard time with it too.
Nobody wants to see the push/pull chatter. What people want to see is the workflow - the high-level shape of the graph, the actual stages, in the order they ran.
The Example: Batching Journal Writes in Akka.Persistence.Sql
Let me use a real graph to make this concrete. This is the Akka.Streams graph built into the Akka.Persistence.Sql plugin - the one we use to batch journal writes together:
flowchart LR
subgraph Writers["Many PersistentActors writing events"]
A1[PersistentActor 1]
A2[PersistentActor 2]
A3[PersistentActor N]
end
Q(["Source.Queue<WriteQueueEntry><br/>OverflowStrategy.DropNew"])
B["BatchWeighted<br/>weight = rows per entry"]
P["SelectAsync<br/>parallelism = N<br/>WriteJournalRows"]
S(["Sink.Ignore"])
DB[("SQL Database")]
A1 --> Q
A2 --> Q
A3 --> Q
Q --> B
B --> P
P -->|INSERT batch in transaction| DB
P --> S
Every persistent actor in the system queues its write operations into a single shared Source.Queue. BatchWeighted aggregates those entries into a set up to a configured transaction size, weighting by the number of rows each entry carries. Then SelectAsync writes each batch into SQL, up to N batches in flight at once. We create a promise per row, and when the batch write succeeds we mark those promises complete so the persistent actor knows its write finished. The whole graph runs under a RestartingDecider supervision strategy.
That’s the workflow a developer cares about: rows queue up, get batched, get written in parallel, and the writes get confirmed. What you do not want to see is the actor-level push/pull traffic that implements all of it.
The Solution: Trace Context Through the GraphInterpreter
We couldn’t solve this from Phobos alone. Because Akka.Streams has such a different shape from ordinary actor messaging, we had to bake the tracing directly into Akka.NET.
We put it in the Akka.Streams component called the GraphInterpreter. Every materialized graph runs its stages through a GraphInterpreter. It wires the stages together and drives the inter-stage messaging, the pushing and pulling between upstream supply and downstream demand, so it’s the one place that sees every stage boundary. That’s exactly where span boundaries belong. Propagate OpenTelemetry trace context through the GraphInterpreter and you capture a trace that follows the workflow through each stage instead of getting lost in the actor plumbing.
This shipped in Akka.NET v1.5.66 as free, built-in functionality. Here’s the PR if you want to see how it works under the covers: akkadotnet/akka.net#8160.
The newest versions of Phobos turn this on automatically.
What It Looks Like in Production
I want to show you what the output actually looks like, traced against a real application.
This is TextForge, one of the SaaS products we launched at Petabridge. TextForge delegates your email inbox to an LLM. It runs Akka.Persistence.Sql backed by Postgres in production, so it exercises exactly the graph I described above.
Here’s the operation I traced, viewed in Seq: rejecting a draft in the TextForge UI. TextForge uses Blazor Server, so when I click the “reject draft” button, the SignalR connection built into Blazor Server fires the event back to the server. From there it’s all Phobos-instrumented actor messaging, plus a manual span TextForge emits itself, until we hit the stream.
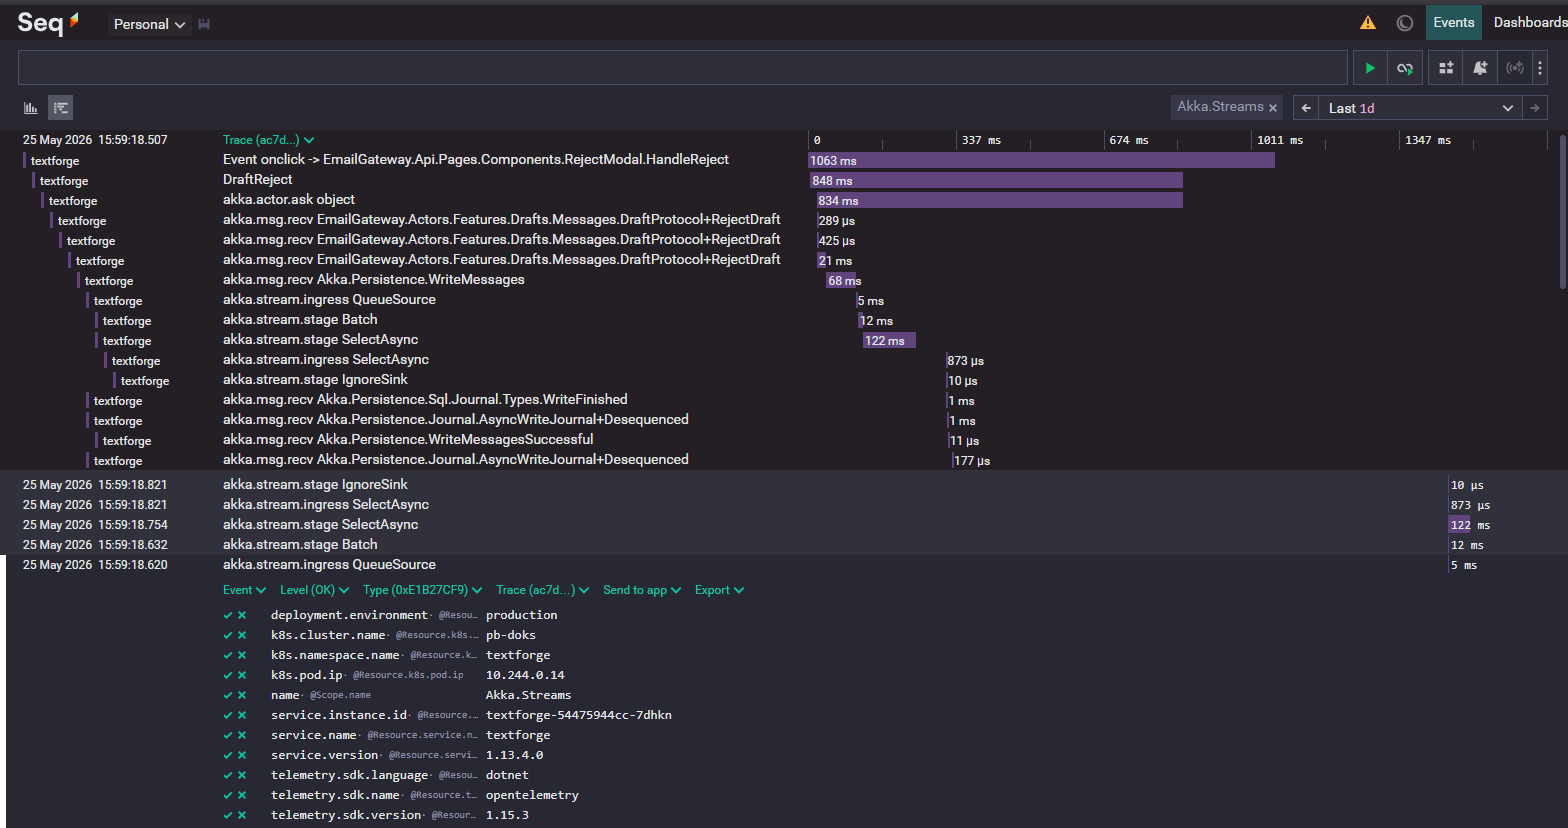 The same operation in Seq. SignalR and Phobos-instrumented actor messaging sit on top, then the Akka.Streams stages -
 QueueSource, Batch, SelectAsync, IgnoreSink - and the Akka.Persistence.Sql journal write (WriteJournalRows) underneath.
When the message steps into the stream from the outside, you see an akkastreams.ingress span on the QueueSource - that’s a message entering the graph. Then you see the batch stage, then SelectAsync, then another ingress span. That second ingress is the message shifting from being queued inside SelectAsync to exiting again, where the actual SQL transactions happen under the covers. Finally we hit Sink.Ignore, and the remaining spans confirm the write completed.
You can even watch what happens next in the same trace: a webhook gets dispatched via distributed pub-sub, we get the response back, and we do some cleanup on the persistent entity. End to end, this whole workflow - including the webhook dispatch - took about a second in this instance.
That’s the entire point. You see the graph execute in its real shape, alongside all the actor messaging and SQL transactions around it, in one coherent trace.
How to Turn It On
Two steps.
First, install Akka.NET v1.5.66 or newer.
Second, register the Akka.Streams source on your OpenTelemetry tracing provider:
services.AddOpenTelemetry()
    .WithTracing(builder =>
    {
        builder.AddSource("Akka.Streams");
    });
Akka.Streams is the name of the ActivitySource we emit the stream spans from, so registering it tells OpenTelemetry to start listening for them. Add that named source with that exact key and you’ll start getting traces visualized in the actual shape of your graph.
If you’re a Phobos customer, you don’t have to do anything - the newest versions of Phobos register the source for you automatically.
The full docs are here.
One Honest Caveat
We haven’t tested this against every Akka.Streams plugin and graph type yet. For everything we’ve tested so far it’s working very well, but Akka.Streams has a lot of design surface and there’s probably more work to do to make this consistent across all of it.
So upgrade to v1.5.66, add the source, and run it against your own graphs. If you hit a graph combination or an Akka.Streams plugin that doesn’t trace cleanly, open an issue or tell us how it went. That feedback is what moves this forward. And if you want this kind of observability across your whole actor system, with Akka.Remote and Akka.Persistence instrumented and the dashboards already built, without wiring any of it up yourself, that’s what Phobos is for.
Observe and Monitor Your Akka.NET Applications with Phobos
Phobos automatically instruments your Akka.NET applications with OpenTelemetry — traces, metrics, and logs with built-in dashboards.

Enjoyed this post? Subscribe to our newsletter for more insights on distributed systems, Akka.NET, and .NET + AI.
// COMMENTS