// BLOG
Why You Should be Paying Attention to OpenTracing
How the Vendor-Neutral Tracing Standard Will Affect Frameworks and Application Development.
In a previous post we introduced distributed tracing and how it solves some of the worst DevOps problems that arise with the use of microservices. In this post we’re going to introduce the OpenTracing standard and talk how what this project does and why you should pay attention to it if you’re a product owner, software architect, or developer.
Middleware, Frameworks, and Instrumentation
Petabridge is committed to delivering world-class tools for developers to build high-performance, large scale software applications in .NET; thus, developing middleware and application programming frameworks, Akka.NET most notably, is a core part of our mission.
All web and Internet-connected applications depend on frameworks and middleware of some kind, because the overwhelming majority of companies who build software don’t want to be in the business of creating and maintaining infrastructure. This is why we have nice tools like ASP.NET Core, SignalR, Akka.NET, gRPC, DotNetty, NServiceBus, RabbitMQ, and so on.
These frameworks provide us with convenient abstractions that:
- Significantly lower the cost of developing software in-house;
- Improve the productivity of individual software developers; and
- Allow for the formation and sharing of industry best practices and standardized designs.
In short, middleware makes the modern software economy possible.
How Asynchrony, Microservices, and Distributed Systems Changed the Economics
As the Internet has grown, there has been a tremendous amount of pressure on server-side software developers to build systems that are available 24/7/365, capable of working across a larger range of devices (desktop, mobile, embedded, etc…,) able to capture and utilize ever-increasing amounts of data, and capable of responding faster and faster to end-user requests. This pressure is what’s driven the adoption of technologies like the actor model, pushed frameworks like .NET to prioritize the development of asynchronous programming constructs such as the TPL, and driven distributed programming into mainstream software development.
Back-end developers adopt these tools, language features, and frameworks in order to meet the demands of customers and users - and it’s usually the case that we have to adopt many different tools to accomplish the job.
There’s no single “silver bullet” that will enable us to build these large scale systems demanded by the business.
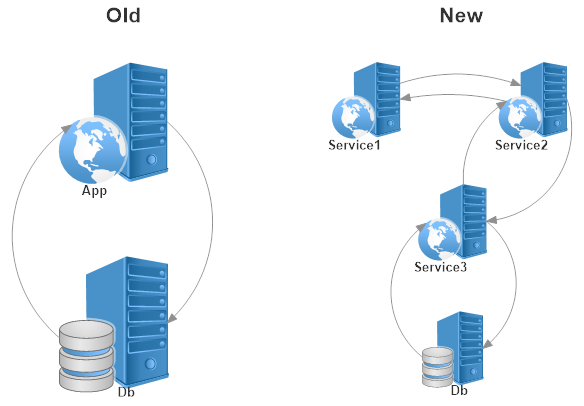
Thus, our applications usually no longer exist as single, monolithic processes implemented in a single programming language and dominated by a single application programming framework. No, today most applications are a collection of interdependent services that compliment each other; implemented using the best tools for the job; often developed using entirely different frameworks and even programming languages; and possibly maintained by totally different parts of the software development organization.
These technical changes to how we structure and develop applications allow software developers to keep pace with the demands of the customers, but not without cost. As we described in detail in our post about why we need distributed tracing, the price of these new tools is paid for by the loss of coherence and observability of how our software works in production. Debugging and troubleshooting problems that were routine under the old monolithic paradigm are now expensive, cross-organizational, frustrating exercises in log correlation and information silo-busting.
Distributed tracing fundamentally solves those problems, by exposing a means of correlating together all of the related activities that occurred, even across service boundaries, in the course of serving a single request.
However, in our exploration of distributed tracing earlier we left out a single, crucial piece of practical information: given that so much of what we build is carried out by third party frameworks, how can we include that activity in the monitoring of our applications? Is it even possible? How expensive will it be? Can it be done consistently throughout all of our applications on all of the runtimes we support?
OpenTracing is a terrific answer to these questions.
OpenTracing in Action
The promise of OpenTracing is to provide library and framework developers with the ability to expose distributed tracing capabilities in a vendor-agnostic manner. To capture activity that occurs within the library or framework and correlate that activity to related work performed by user-specific code.
![]()
But it’s the vendor-agnostic facet of OpenTracing that makes it so valuable.
Just like with traditional monitoring and logging services, there’s an abundance of distributed tracing tools available to end-users. Zipkin, Jaeger, LightStep, DataDog, and dozens of others. Library and framework developers don’t want to put themselves or their users in the position of having to bet the farm on a single tool, thus we should avoid tightly coupling our middleware to a single vendor’s tracing solution.
But unlike monitoring or logging, tracing is a much more invasive and context-specific exercise. In order for trace data to be meaningful we have to:
- Consistently capture relevant data about the state of our environment at runtime;
- Correctly correlate and sequence asynchronous and concurrent activities, even across multiple processes; and
- Publish all of this data back to a single source so it can be gathered together and rendered into information that is usable by humans.
Thus, in order for popular piece of middleware to expose useful tracing capabilities to its end users it needs to have some standardized way of capturing and correlating all of this data. This is what OpenTracing provides.
OpenTracing Features
OpenTracing ships as a series of interfaces, standard data formats, and common terminologies that are shared and implemented by many distributed tracing products.
Phobos, our tracing tool for Akka.NET applications, supports numerous tracing engines through our use of OpenTracing.
First, some key ideas implemented by all OpenTracing-compatible tracers:
- Trace - an end-to-end trace of an end-user request inside a distributed application; this trace might include correlating data from multiple services and multiple processes. It’s the output of the distributed tracing system.
- Span - a single, atomic unit of work that occurs inside an application. This can be one HTTP request processing method on an MVC controller, an Akka.NET actor processing a message, a RabbitMQ client sending a single message over the network, and so forth. Spans contain contextual data such as the name of the operation, the server / application it was executed on, the start and stop times, log events, and key / value pairs of tags that can be used to make the span searchable. A trace is constructed from the sum of its spans.
- SpanContext - a descriptor that is included inside each span which describes this span’s relationship to its parent span (i.e. the previous operation that occurred in processing the request) and to the trace itself. The SpanContext can also include “baggage” - key/value pairs of data that are propagated from one operation to the next. How this gets implemented is specific to each tracing implementation.
- Propagation - propagation is the tool used to serialize and deserialize data across service boundaries. Having standardized ways of representing trace ID, span IDs, and possibly baggage across service boundaries is one of the key ingredients for correlating data across services. In fact, it’s become so important that the W3C is actively working on implementing standardized distributed tracing header formats that will eventually make their way into HTTP itself. OpenTracing exposes some standard tools and formats for injecting / extracting trace information from requests, including non-HTTP vehicles such as Akka.NET actor messages, gRPC events, and so forth.
These standards from the OpenTracing specification are the bedrock upon which library maintainers can successfully expose tracing capabilities to end-users, and these standards are expressed through the use of the OpenTracing library and its interfaces.
OpenTracing API
The OpenTracing APIs are made available through public packages in many different runtimes and programming languages, and here are the major constructs that get exposed directly to end-users and through middleware itself:
ITracer- the interface which exposes all of the actual tracing capabilities directly to end-users;ISpanBuilder- a builder interface used for creating and startingISpaninstances used to capture data for specific operations;ISpan- the data structure used to contain and modify all contextual data related to the current span;IScopeManager- the most interesting tool inside OpenTracing, theIScopeManageris used to help correlate activity that occurs asynchronously inside a single process. For instance, in the C# implementation of OpenTracing we have theAsyncLocalScopeManager, which uses theAsyncLocalto keep track of which span is currently active and can automatically correlate any new child spans together with theISpancurrently held inside theAsyncLocalcontext.
A full example for instantiating and using an OpenTracing-compatible ITracer might look something like this, using Petabridge’s OpenTracing adapter for Microsoft Application Insights:
// running inside an Akka.NET actor
// use the active TelemetryConfiguration, if available
var tracer = new ApplicationInsightsTracer(TelemetryConfiguration.Active);

// record some new spans
using (var current = tracer.BuildSpan(Context.Self.Path.ToString()).StartActive())
{
    _loggingAdapter.Info(str);
    current.Span.Log(str);
    current.Span.SetTag("strLen", str.Length);

    using (var subOp = _tracer.BuildSpan(Context.Self.Path.ToString() + ".subOp").StartActive())
    {
        subOp.Span.Log("Do nested operations work?");
        subOp.Span.SetTag("nested", true);
    }
}
The OpenTracing project has more detailed C# guides which explain how to use their APIs, but what’s important is that driver packages such as Petabridge.Tracing.Zipkin or the official C# Jaeger driver all program against the OpenTracing interfaces out of the box. Therefore, in order for a piece of middleware like Phobos or ASP.NET Core to work with your preferred tracing library, we only need to program against the OpenTracing interfaces and we can let the underlying driver implement them.
Why You Should Care about OpenTracing
So why should you, as an end-user, care about OpenTracing? Because the proliferation of the OpenTracing standard into both the libraries and frameworks you use and its adoption by tracing vendors will help improve the state of the art as a whole. It’ll give you and your organization the ability to observe the runtime behavior of your distributed applications regardless of programming language, framework, and runtime and you’ll be able to do it using a plethora of available tools.
In other words, more OpenTracing means more ease of use, improved observability, and more choices for developers like us. We should encourage its adoption everywhere when possible.
OpenTracing has already been around for years and it’s quickly picking up momentum in the .NET ecosystem and beyond. If you’re interested in learning more about it, we strongly encourage that you check out the OpenTracing C# implementation guides and follow OpenTracing on Twitter.
Observe and Monitor Your Akka.NET Applications with Phobos
Phobos automatically instruments your Akka.NET applications with OpenTelemetry — traces, metrics, and logs with built-in dashboards.

Enjoyed this post? Subscribe to our newsletter for more insights on distributed systems, Akka.NET, and .NET + AI.
// COMMENTS