How Distributed Tracing Solves One of the Worst Microservices Problems
Distributed Tracing Solves Some Big Pain Points with Microservices
8 minutes to readHistorically most web applications were developed as monolithic architectures. The entire application shipped as a single process implemented on a single runtime. Ultimately this architectural choice makes scaling software development extremely painstaking and tedious, because 100% of code changes submitted by members of any development team target a single code base. Under monolithic designs deployments are executed as “all or nothing” affairs - either you deploy all parts of your application at once or you deploy none of them.
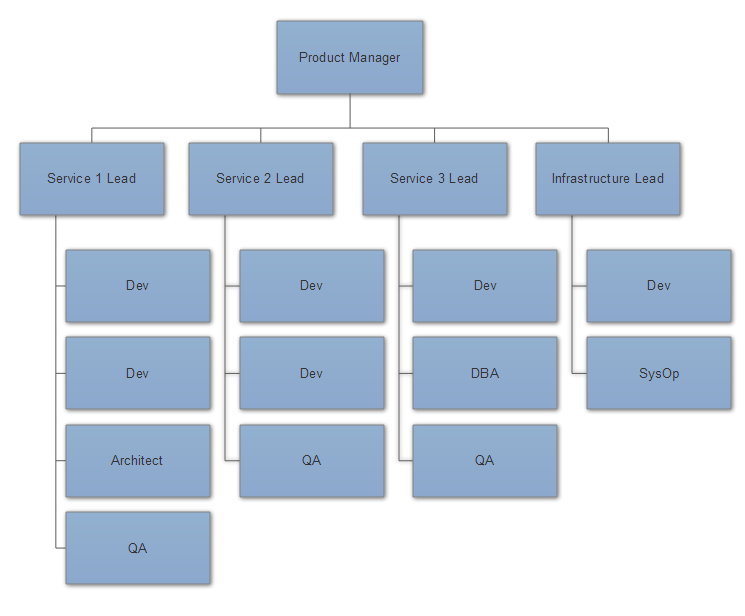
It’s for painful reasons like this that the industry is moving away from monoliths and towards distributed architectures such as microservices. What microservices provide isn’t product scalability; they provide people scalability - the ability to easily partition your software development organization along the same lines as you partition your application with service boundaries.
DevOps Implications of Microservices
Microservices provide enormous agility and flexibility to software development organizations. By partitioning our large applications into interdependent services which communicate via explicit network communication contracts, each team encapsulates their implementation from the others. This makes it possible, in theory, for each team to choose the best tools for the job - if Service 1’s requirements are best satisfied using Node.JS and Redis but Service 2’s are better handled with .NET and SQL Server, both of these teams can make those choices and develop / deploy their services independently of each other.
In practice, microservices are really a trade off for one set of organizational and technical problems for others. While the benefits of microservices amount to greater independence; clearer organizational boundaries and division of labor; and greater agility those benefits come with some distinct costs:
- Loss of coherence - now that the work to fulfill a single end-user request is now broken across multiple processes, possibly written in multiple frameworks and implementation languages, it is much harder for team members to understand what exactly happened in the course of processing a request. Unlike a monolithic process, where we could gather the complete story of how a request was handled from a single process written in a single language, we no longer have an easy way of doing that in a microservices environment.
- Increased debugging and troubleshooting cost - given the loss of coherence imposed by microservices, the act of tracking down and fixing sources of errors inside microservice architectures can be tremendously more expensive and time-consuming than its counter-parts. To add to this, in most cases failure data isn’t propagated in an immediately useful or clear manner inside microservices; instead of an immediately understandable stacktrace, we have to work backwards from status codes and vague error messages propagated across the network.
- Data silos and cross-team communication - given that one request has to make multiple hops over the network and has to be handled by multiple processes developed by independent teams, figuring out exactly where an error occurred and whose responsibility it is to fix can become an exercise in futility and frustration. The practice of debugging microservices often involves sitting developers from multiple conference teams down in a conference room correlating timestamped logs from multiple services.
DevOps Tools Need to be Adapted to Properly Support Distributed Architectures
The core of the problem really is that distributed approaches to developing software, such as microservices, really require different tools than what we used in the past when developing monoliths. We can’t expect to attach debuggers to four different processes and try to step-through-debug requests in that environment.
This is where distributed tracing enters the fray - it takes the concept of tracing, which works really well at telling the story of how a request was handled from the point of view of a single monolithic process and extends it to tell the story from the point of view of all of the processes involved in handling a single request.
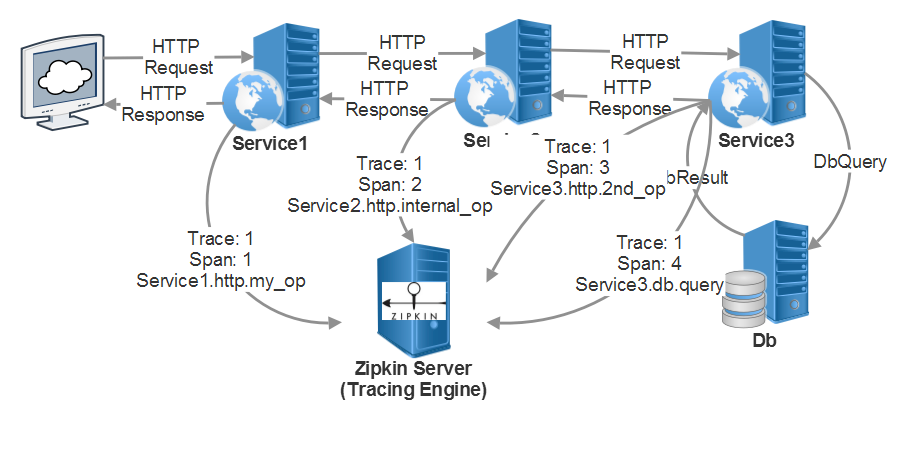
A trace begins when a user sends an initial request to an entry point of your application. A brand new trace ID is generated, and each successive request will be decorated with HTTP headers (or whatever your system uses, whether it’s Akka.NET or RabbitMQ) that contain correlation data back to the original request.
Each individual operation invoked as part of fulfilling that end-user’s request is called a “span,” and each span is tagged both with its own unique ID as well as the ID of the trace and the ID of the “parent” span - the ID of the operation and created the current request. All of this correlation data is propagated downstream and then reported out of band to a distributed tracing engine.
Each span captures important data points specific to the current microservice process handling a request, such as:
- Tags, for being able to lookup requests by session ID, HTTP method, and any other number of other dimensions;
- Logs and events, to help establish context about what the process is currently doing;
- The exact service name and address of the process handling this request right now; and
- In failure conditions, detailed stack traces and error messages.
This feature of distributed tracing makes it possible to correlate data across multiple processes together and figure out exactly where something went wrong in the course of processing and end-to-end request from a user or customer. And the best part is: most popular distributed tracing tools have support in every major programming language and have plugins for targeting major web frameworks, message buses, actor frameworks, and more. With a tool like Zipkin or Jaeger, we can solve our microservice architecture’s coherence and data silo problems by propagating distributed trace data between our services and then reporting spans back to the reporting servers included with those tools.
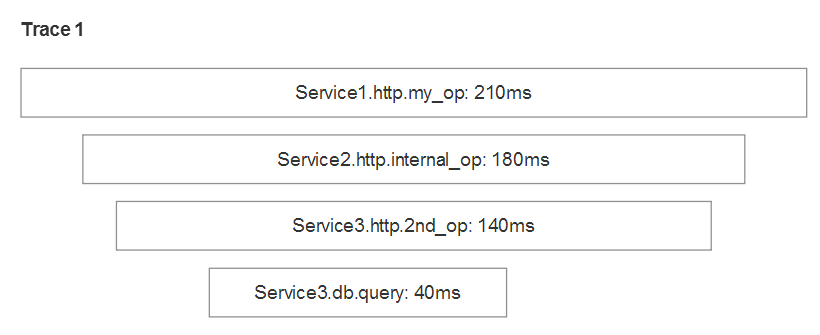
A distributed tracing engine, such as Zipkin or Jaeger, correlates these related spans and makes the request data for any particular operation both searchable and easy to understand using powerful visualization tools. Most tools visualize the traces using a histogram, like this one:
Benefits of Distributed Tracing
The benefits of distributed tracing for software development teams are numerous.
- Distributed tracing radically improves developer productivity and output by making it easy to understand the behavior of distributed systems. Distributed tracing tools are easy to setup and they will help you and your team drastically reduce time spent debugging and troubleshooting issues with your systems.
- Distributed tracing works across multiple applications, programming languages, and transports – Ruby on Rails applications can propagate traces to .NET applications over HTTP, RabbitMQ, WebSockets, or other transports and all of the relevant information can still be uploaded, decoded, and visualized by the same tracing engine such as Zipkin. There are no other tools in market that can do this.
- Distributed tracing can also help improve time to market by making it easy to immediately see how updates and rollouts to your services impact the application as a whole in real time.
- Most importantly, distributed tracing facilitates excellent cross-team communication and cooperation. It eliminates costly data silos that could otherwise hinder developers’ ability to quickly locate and fix sources of error.
If you want to learn more about adopting distributed tracing for your organization, we’d encourage you to watch our video “Why You Should Use Distributed Tracing Tools”
And for further reading:
- Demo Video: “Phobos Akka.NET Tracing with Zipkin”
Petabridge.Tracing.Zipkin- our Zipkin driver implementation.- Zipkin distributed tracing engine
- The OpenTracing distributed tracing standard
- Read more about:
- Akka.NET
- Case Studies
- Videos
Observe and Monitor Your Akka.NET Applications with Phobos
Did you know that Phobos can automatically instrument your Akka.NET applications with OpenTelemetry?
Click here to learn more.