// BLOG
Performance Testing Should be Mandatory
Plus, How to Actually do it Right
Back in December I released the first publicly available version of NBench - Petabridge’s automated .NET performance testing and benchmarking framework.
NBench has proven itself to be an invaluable part of our QA process for Akka.NET and scores of other projects, for one critical reason: performance is a mission critical feature for an increasingly large number of applications. And if you can’t measure performance, then you’re shipping a totally untested feature to your end-users.
The Impact of Poor Performance
A simple anecdote to illustrate the real-world impact of shipping non-performant software.
One of my favorite musicians, whom I have never seen live before, is coming to town and I wanted to purchase a ticket. I was out of the country the day tickets went on sale, so if I wanted to attend I’d need to buy a ticket from a secondary market.
I decided to give a new company I’d never purchased tickets through before, SeatGeek, a try. I quickly found two tickets for about $100 each, went through the checkout process, put in my payment information, and submitted payment. A few seconds later I get an error message back letting me know that the tickets were no longer available. So I repeat this process a few more times with progressively more expensive tickets with no success.
Eventually I just gave up and SeatGeek lost about $500 worth of revenue, because I lost any confidence that their reported ticket inventory was available. The crucial error was that the underlying software responsible for reporting inventory availability under-performed - it wasn’t able to keep up with the demand of actual customers, and as a result they nearly lost my business. I tried again on a whim immediately before writing this post and was able to purchase a ticket with no issues this time. But you can’t depend on users giving you a second chance in production.
This is the “missed opportunities” impact of failing to deliver performant software; here’s some of the others:
- Availability - going down because of performance regressions in new versions of software;
- Throughput Decrease - doing less business (like the anecdote) due to inability to meet demand;
- Incompatibility - suddenly exceeding the hardware requirements of end-users because of increased resource or bandwidth consumption;
- User Experience - there’s an abundance of empirical research that demonstrates a direct correlation between speed and quality of user experience, so worse speed = worse experience; and
- Failure to Meet Service Level Agreements - have enterprise customers? Congrats, you have an SLA and it probably covers details such as uptime and turnaround time. A decrease in performance will threaten your ability to do both.
Performance as a Feature
End-users not only expect your service to work correctly - they expect your service to be available whenever they need it and to be appropriately responsive. These end-user expectations aren’t absolute, but they’re not optional either - your service may as well not exist if it can’t stay up.
So to meet these expectations, we have to test performance just like the functionality of any other feature.
Performance Lifecycle Management
To do an adequate job elevating performance to a first-class feature in our application, we have to adopt a performance lifecycle to our release and development processes.
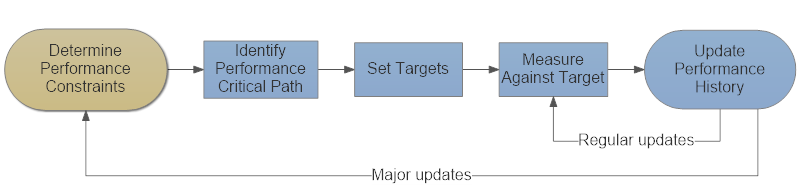
- First, we choose Performance Constraints - often these are determined by you or your customer’s hardware, environment (including SLAs,) budget, and resources. An iPhone application and a massive distributed system running on AWS will have very different performance constraints.
- Next we identify the Performance Critical Path, all of the code and external API calls that sit between the end user and their expected output where our performance goals are defined.
- We set Performance Targets or Goals and these should be specific, e.g. “we should always be able to process at least 1,000,000 requests per second on [critical path web service method] across [hardware configuration] with a 99% percentile response time of no longer than 250ms.”
- We Measure Against Target to see how well each version of the software satisfies the goal.
- Lastly, we Update the Performance History so we have a record establishing our performance at this point in time.
There are scores of different tools that serve different functions in this lifecycle. A good profiling tool like MiniProfiler or Glimpse will help you identify the critical path and some of the potential bottlenecks that need to be fixed. A monitoring and alerting tool like Grafana will track how well your system does against high-level performance goals.
And a tool like NBench is used for measuring the performance of individual components and building a history of those measurements.
“If you can measure it, you can control it”
Of all of the different portions of this lifecycle, the most important is to begin building a history of your performance over time.
Having a reliable performance history is what gives your team the ability to behave strategically with respect to performance - everyone can compare how well the current version of the product performs relative to the previous and whether or not a proposed change is actually an improvement over the other.
I originally developed NBench to help solve some problems with the remoting layer inside Akka.NET, and we were able to use automated NBench tests and their recorded histories to produce a 5x performance in throughput across a single Akka.Remote connection in a matter of weeks.
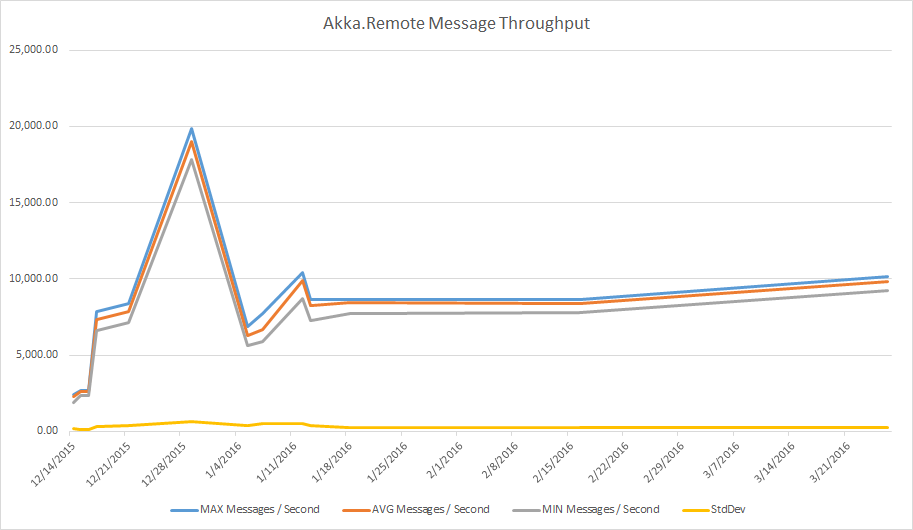
When Akka.NET v1.0.4 first shipped, users reported a significant drop in performance on Akka.Remote compared to what we delivered in Akka.NET v1.0.3. We set out to fix this as fast as possible, and I developed the first version of NBench as a tool to solve this issue specifically.
I wrote a RemoteMessagingThroughputSpec and used it to clock the default messages per second of Akka.Remote using an in-memory transport on December 14, 2015 - 2.3k messages per second. Ouch!
But, with a system in place that our team could measure against - 3 contributors teamed up to improve this number, and produced the above graph showing a 5x improvement in throughput within four weeks.
Here are the key dates and changes:
| Date | MAX Messages / Second | AVG Messages / Second | MIN Messages / Second | StdDev | Comment |
|---|---|---|---|---|---|
| 12/14/2015 | 2,434.02 | 2,296.17 | 1,891.37 | 169.56 | First recorded performance |
| 12/15/2015 | 2,679.82 | 2,601.85 | 2,371.32 | 101.72 | String.Format fix |
| 12/16/2015 | 2,680.19 | 2,575.15 | 2,334.53 | 90.78 | |
| 12/17/2015 | 7,844.49 | 7,334.62 | 6,592.14 | 316.2 | ForkJoin dispatcher |
| 12/21/2015 | 8,368.28 | 7,875.11 | 7,126.98 | 373.68 | General upgrade of remoting system |
| 12/29/2015 | 19,857.39 | 18,981.07 | 17,820.45 | 666.05 | Introduced bug in test |
| 1/5/2016 | 6,900.82 | 6,283.47 | 5,627.46 | 350.96 | Fixed bug; reset Azure VM size |
| 1/7/2016 | 7,710.67 | 6,681.43 | 5,914.43 | 490.86 | |
| 1/12/2016 | 10,428.87 | 9,878.33 | 8,673.25 | 479 | Fixed dedicated thread pool performance |
| 1/13/2016 | 8,650.33 | 8,256.68 | 7,245.91 | 347.28 | Not sure |
| 1/18/2016 | 8,640.98 | 8,444.17 | 7,731.65 | 249.98 | |
| 2/16/2016 | 8,624.32 | 8,375.90 | 7,772.23 | 239.3 | |
| 3/26/2016 | 10,127.51 | 9,828.98 | 9,248.85 | 237.51 |
Our system is by no means perfect (Windows Azure blew up our build agent machine image on New Year’s Eve 2015, we think because it was a Store image comes with a Visual Studio license on it,) but it gave us the ability to significantly improve the performance quickly. And our new Akka.Remote transport scheduled for release in Akka.NET 1.5 has posted numbers in the 100k messages per second per connection range.
The point of all of this is - we can collectively see how the series of changes made to the components on the critical path created an incrementally better experience for end-users.
When we treat performance like a critical feature and give it the appropriate quality assurance treatment, it gives us more confidence in our software and a better experience for our end-users. Performance testing and benchmarking should be part of everyone’s development lifecycle, just like unit testing and everything else.
Observe and Monitor Your Akka.NET Applications with Phobos
Phobos automatically instruments your Akka.NET applications with OpenTelemetry — traces, metrics, and logs with built-in dashboards.

Enjoyed this post? Subscribe to our newsletter for more insights on distributed systems, Akka.NET, and .NET + AI.
// COMMENTS