In our final lesson, now that we have a fully-functioning Akka.NET cluster running inside Kubernetes, we’re going to learn how to add some observability into our Akka.NET application by installing Phobos, Petabridge’s Akka.NET distributed tracing and monitoring tool.
![]()
Phobos requires access to a private Phobos NuGet feed provided by Petabridge. If you’re attending one of our in-person Akka.NET training events this will be provided to you by your instructor. Otherwise, you can request a free 30-day Phobos evaluation for your company here.
Getting Started
To start this lesson, we need to checkout to the lesson6 branch in our git repository:
PS> git checkout lesson6
Once you’ve done that, open the NuGet.config file in root directory of the repository and replace {YOUR PHOBOS URL} with the Phobos NuGet key provided to you:
<?xml version="1.0" encoding="utf-8"?>
<configuration>
  <solution>
    <add key="disableSourceControlIntegration" value="true" />
  </solution>
  <packageSources>
    <clear />
    <add key="nuget.org" value="https://api.nuget.org/v3/index.json" />
    <add key="phobos" value="{YOUR PHOBOS URL}" />
  </packageSources>
</configuration>
Once this is complete, you’ll now be able to install and download Phobos NuGet packages.
Installing Phobos
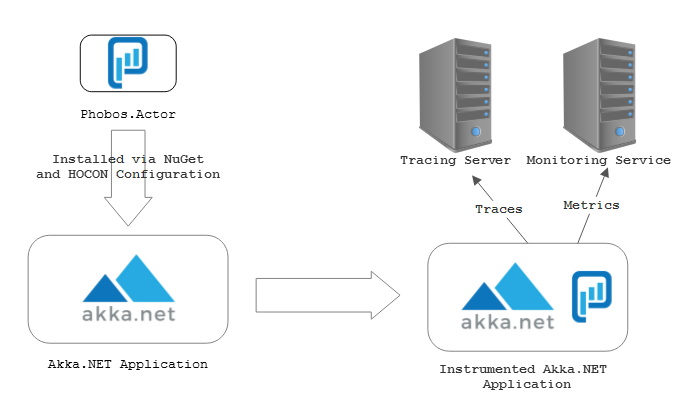
In this lesson, we’re going to leverage Phobos’ actor tracing and monitoring capabilities to help see what’s going on inside the Akka.CQRS application.
How Phobos Works
Phobos itself is just a series of NuGet packages, designed to be able to automatically inject monitoring and tracing instrumentation into your actors through a minimal amount of HOCON configuration. As you’ll see in this lesson, you don’t have to use any code to see output from Phobos - it all happens automatically behind the scenes.
Phobos depends on third party monitoring and tracing services in order to publish the metrics it collects, and you can see an ongoing list of Phobos monitoring and tracing tool integrations here.
In this lesson we’re going to use the following two tools to help monitor our cluster:
- Jaeger - a free, open source distributed tracing tool developed originally by Uber. We’re going to use this to visualize actor communication happening across the cluster.
- StatsD - a free, open source real-time stats aggregation system for tracking useful key-performance indicators about our actors.
Once we’ve installed the relevant Phobos packages into Akka.CQRS, we’ll see Phobos transmit tracing and metrics data out to both of these systems - and from there we can use the Web UIs provided by both platforms to help inspect what’s going on inside our Akka.NET cluster.
Installing and Configuring Phobos
Edit the Akka.CQRS.Infrastructure.csproj file in Visual Studio:
  <ItemGroup Condition="'$(Configuration)' == 'Phobos'">
    <!-- Uncomment these to install Phobos binaries -->
    <!--<PackageReference Include="Phobos.Actor.Cluster" Version="$(PhobosVersion)" />
    <PackageReference Include="Phobos.Tracing.Jaeger" Version="$(PhobosTracingVersion)" />
    <PackageReference Include="Phobos.Monitoring.StatsD" Version="$(PhobosMonitoringVersion)" />-->
  </ItemGroup>
Uncomment the selected lines - these MSBuild properties will become active and will allow the Akka.CQRS project to pull in these Phobos dependencies whenever it’s compiled using the Phobos solution configuration.
NOTE: The
$(PhobosVersion),$(PhobosTracingVersion), and$(PhobosMonitoringVersion)MSBuild variables are set insidecommon.props- as are the rest of the commonly used NuGet package versions used by the Akka.CQRS solution. If you want to change the version of any of the Phobos packages used, simply edit that file.
Here’s what each of these packages does:
- Phobos.Actor.Cluster - this is the package that contains all of the relevant instrumentation code for tracing and monitoring your Akka.NET actors’ activities in the background;
- Phobos.Tracing.Jaeger - this is the Phobos first-party adapter built around the official Jaeger C# drivers - it’s needed in order to export all tracing data to Jaeger.
- Phobos.Monitoring.StatsD - same idea as the Jaeger driver, this is the first-party StatsD driver used by Phobos.
Akka.CQRS.Infrastructure is referenced by all of the projects that we package into Docker images, so updating this project is all we need to ensure that the Phobos NuGet packages are available everywhere else.
Next, we need to configure Phobos via the HOCON configuration loaded into our ActorSystem, which we can do by updating the Akka.CQRS.Infrastructure/Ops/phobos.conf file to look like the following:
# Used only instances where PHOBOS_ENABLED is set to TRUE
akka.actor.provider = "Phobos.Actor.Cluster.PhobosClusterActorRefProvider,Phobos.Actor.Cluster"

phobos{
	monitoring{
		sample-rate = 0.1
		provider-type = statsd
		monitor-mailbox-depth = on
		statsd{
			endpoint = 127.0.0.1
		}
	}

	tracing{
		sample-rate = 0.1
		provider-type = jaeger
		jaeger{
			agent{ # for UDP reporting
				host = localhost
				port = 6831
			}
		}
	}
}
Once you’ve updated phobos.conf accordingly, Phobos will be automatically instrumented inside all of your services except for Lighthouse.
But before we move on, let’s break down what this configuration file does.
The most important line is when we set the akka.actor.provider:
akka.actor.provider = "Phobos.Actor.Cluster.PhobosClusterActorRefProvider,Phobos.Actor.Cluster"
This is what actually loads and enables the Phobos instrumentation for Akka.Cluster. The PhobosClusterActorRefProvider simply wraps the normal ClusterActorRefProvider we use as part of Akka.Cluster and injects monitoring and tracing instrumentation at startup into each of the actors we create at run-time.
The rest of the HOCON configuration tells Phobos how to configure its drivers.
When we specify phobos.monitoring.provider-type = statsd and phobos.tracing.provider-type = jaeger, this tells Phobos to load its StatsD monitoring driver from the Phobos.Monitoring.StatsD NuGet package and the Jaeger tracing driver from the Phobos.Tracing.Jaeger package respectively.
NOTE: It’s possible to load custom, third-party Phobos drivers inside these configuration fields too. All you need to do is specify the fully-qualified type name of a monitor that implements the
Phobos.Monitoring.Actor.MetricRecorderProviderBaseclass or a tracer that implements thePhobos.Tracing.TracerProviderBaseclass.
Naturally, the phobos.monitoring.statsd and the phobos.tracing.jaeger HOCON configuration sections include configuration details that are specific to the StatsD and Jaeger Phobos drivers - and we will revisit those settings in a moment when we take a look at the AppBootstrap class.
However, there is one crucial setting that we’ve applied to both the monitoring and tracing configurations that we need to explore.
Sampling and Other Best-Practices in High Performance Akka.NET Systems
You’ll notice the following two settings inside phobos.conf:
phobos.monitoring.sample-rate = 0.1
phobos.tracing.sample-rate = 0.1
All Phobos drivers support sampling - meaning that we only export a percentage of all traces and metrics to their intended targets.
This is really helpful in environments where your actors produce a lot of message traffic - saving trace data in particular can be rather expensive, so it’s not always a good practice to record 100% of message traffic in this manner. In the Akka.CQRS sample, since we’re running on Docker and Kubernetes in a local environment that doesn’t have a lot of resources, we’re going to use sampling to help reduce some of the strain on our local Docker infrastructure.
Bonus Exercise: There are a number of other Phobos performance best practices for high throughput Akka.NET actor systems, such as filtering, enabling monitoring or tracing for only specific groups of actors, and more. As a self-directed exercise, you should consider implementing some of those on your own. Which ones make sense for Akka.CQRS?
Dynamically Configuring Jager and StatsD
So one thing we want to avoid doing, as best as we can, is hard-coding the Jaeger and StatsD addresses into our HOCON configuration as that will make it more difficult for us to deploy Akka.CQRS into multiple environments, such as production, staging, testing, and local development.
Instead, we’re going to override the default values populated inside phobos.conf using environment variables, similar to what we did in lesson 2 with Docker and Akka.Bootstrap.Docker.
This is where the AppBootstrap class comes in when we’re compiling Akka.CQRS under its Phobos solution configuration:
#if PHOBOS
public const string ENABLE_PHOBOS = "ENABLE_PHOBOS";


/// <summary>
///     Name of the <see cref="Environment" /> variable used to direct Phobos' StatsD
///     output.
/// </summary>
public const string STATSD_URL = "STATSD_URL";


/// <summary>
///     Name of the <see cref="Environment" /> variable used to direct Phobos' StatsD
///     output.
/// </summary>
public const string STATSD_PORT = "STATSD_PORT";


/// <summary>
///     Name of the <see cref="Environment" /> variable used to direct Phobos' Jaeger
///     output.
/// </summary>
public const string JAEGER_AGENT_HOST = "JAEGER_AGENT_HOST";


public static Config BootstrapPhobos(this Config c, AppBootstrapConfig appConfig)
{
    var enablePhobos = Environment.GetEnvironmentVariable(ENABLE_PHOBOS);
    if (!bool.TryParse(enablePhobos, out var phobosEnabled))
    {
        // don't turn on Phobos
        return c;
    }
    else if (!phobosEnabled)
    {
        // don't turn on Phobos
        return c;
    }


    var phobosConfig = GetPhobosConfig();


    var statsdUrl = Environment.GetEnvironmentVariable(STATSD_URL);
    var statsDPort = Environment.GetEnvironmentVariable(STATSD_PORT);
    var jaegerAgentHost = Environment.GetEnvironmentVariable(JAEGER_AGENT_HOST);


    if (!string.IsNullOrEmpty(statsdUrl) && int.TryParse(statsDPort, out var portNum))
        phobosConfig = ConfigurationFactory.ParseString($"phobos.monitoring.statsd.endpoint=\"{statsdUrl}\"" +
                                                        Environment.NewLine +
                                                        $"phobos.monitoring.statsd.port={portNum}" +
                                                        Environment.NewLine +
                                                        $"phobos.tracing.jaeger.agent.host={jaegerAgentHost}")
            .WithFallback(phobosConfig);


    if (!appConfig.NeedClustering)
    {
        var config = ConfigurationFactory.ParseString(@"akka.actor.provider = ""Phobos.Actor.Remote.PhobosRemoteActorRefProvider, Phobos.Actor.Remote""");
        return config.WithFallback(phobosConfig).WithFallback(c);
    }


    return phobosConfig.WithFallback(c);
}
#endif
We need the following environment variables set in order to run Phobos:
ENABLE_PHOBOS- if this value is notnull, Phobos will be injected into ourActorSystems’ configurations;STATSD_URL- the URL or hostname of the StatsD UDP endpoint we can write to;STATSD_PORT- the port number for the StatsD service; andJAEGER_AGENT_HOST- the UDP endpoint used for reporting spans to the Jaeger collection agent.
If all of these values are provided, we should be good to go. And as you can see in the Kubernetes YAML files you created for our Akka.NET services in Lesson 5, we’ve already pre-populated these values inside each of the replicaset and deployment definitions we created for our services, such as this definition from the Akka.CQRS.Pricing.Web` service:
- name: ENABLE_PHOBOS
  value: "true"
- name: STATSD_PORT
  value: "8125"
- name: STATSD_URL
  value: "statsd-agent"
- name: JAEGER_AGENT_HOST
  value: "jaeger-agent"
The STATSD_URL and JAEGER_AGENT_HOST properties refer to the Kubernetes ClusterIp services names for our StatsD and Jaeger services respectively - so we’ll need to add those services to our Kubernetes cluster first!
Deploying Phobos Infrastructure
In the k8s directory of your solution, please copy the following two Kubernetes YAML file definitions:
#
# Copyright 2017-2019 The Jaeger Authors
#
# Licensed under the Apache License, Version 2.0 (the "License"); you may not use this file except
# in compliance with the License. You may obtain a copy of the License at
#
# http://www.apache.org/licenses/LICENSE-2.0
#
# Unless required by applicable law or agreed to in writing, software distributed under the License
# is distributed on an "AS IS" BASIS, WITHOUT WARRANTIES OR CONDITIONS OF ANY KIND, either express
# or implied. See the License for the specific language governing permissions and limitations under
# the License.
#

apiVersion: v1
kind: List
items:
- apiVersion: extensions/v1beta1
  kind: Deployment
  metadata:
    namespace: akka-cqrs
    name: jaeger
    labels:
      app: jaeger
      app.kubernetes.io/name: jaeger
      app.kubernetes.io/component: all-in-one
  spec:
    replicas: 1
    strategy:
      type: Recreate
    template:
      metadata:
        labels:
          app: jaeger
          app.kubernetes.io/name: jaeger
          app.kubernetes.io/component: all-in-one
        annotations:
          prometheus.io/scrape: "true"
          prometheus.io/port: "16686"
      spec:
          containers:
          -   env:
              - name: COLLECTOR_ZIPKIN_HTTP_PORT
                value: "9411"
              image: jaegertracing/all-in-one
              name: jaeger
              ports:
                - containerPort: 5775
                  protocol: UDP
                - containerPort: 6831
                  protocol: UDP
                - containerPort: 6832
                  protocol: UDP
                - containerPort: 5778
                  protocol: TCP
                - containerPort: 16686
                  protocol: TCP
                - containerPort: 9411
                  protocol: TCP
              readinessProbe:
                httpGet:
                  path: "/"
                  port: 14269
                initialDelaySeconds: 5
- apiVersion: v1
  kind: Service
  metadata:
    namespace: akka-cqrs
    name: jaeger-query
    labels:
      app: jaeger
      app.kubernetes.io/name: jaeger
      app.kubernetes.io/component: query
  spec:
    ports:
      - name: query-http
        port: 8881
        protocol: TCP
        targetPort: 16686
    selector:
      app.kubernetes.io/name: jaeger
      app.kubernetes.io/component: all-in-one
    type: LoadBalancer
- apiVersion: v1
  kind: Service
  metadata:
    namespace: akka-cqrs
    name: jaeger-collector
    labels:
      app: jaeger
      app.kubernetes.io/name: jaeger
      app.kubernetes.io/component: collector
  spec:
    ports:
    - name: jaeger-collector-tchannel
      port: 14267
      protocol: TCP
      targetPort: 14267
    - name: jaeger-collector-http
      port: 14268
      protocol: TCP
      targetPort: 14268
    - name: jaeger-collector-zipkin
      port: 9411
      protocol: TCP
      targetPort: 9411
    selector:
      app.kubernetes.io/name: jaeger
      app.kubernetes.io/component: all-in-one
    type: ClusterIP
- apiVersion: v1
  kind: Service
  metadata:
    namespace: akka-cqrs
    name: jaeger-agent
    labels:
      app: jaeger
      app.kubernetes.io/name: jaeger
      app.kubernetes.io/component: agent
  spec:
    ports:
    - name: agent-zipkin-thrift
      port: 5775
      protocol: UDP
      targetPort: 5775
    - name: agent-compact
      port: 6831
      protocol: UDP
      targetPort: 6831
    - name: agent-binary
      port: 6832
      protocol: UDP
      targetPort: 6832
    - name: agent-configs
      port: 5778
      protocol: TCP
      targetPort: 5778
    clusterIP: None
    selector:
      app.kubernetes.io/name: jaeger
      app.kubernetes.io/component: all-in-one
- apiVersion: v1
  kind: Service
  metadata:
    name: zipkin
    labels:
      app: jaeger
      app.kubernetes.io/name: jaeger
      app.kubernetes.io/component: zipkin
  spec:
    ports:
    - name: jaeger-collector-zipkin
      port: 9411
      protocol: TCP
      targetPort: 9411
    clusterIP: None
    selector:
      app.kubernetes.io/name: jaeger
      app.kubernetes.io/component: all-in-one
apiVersion: v1
kind: Service
metadata:
  name: statsd-agent
  namespace: akka-cqrs
  labels:
    app: statsd
spec:
  ports:
  - port: 8125
    name: statsd-agent
    protocol: UDP
  - port: 8126
    name: statsd-agent2
    protocol: TCP
  - port: 2003
    name: graphite-1
    protocol: TCP
  - port: 2004
    name: graphite-2
    protocol: TCP
  selector:
    app: statsd
  type: ClusterIP
---
apiVersion: v1
kind: Service
metadata:
  namespace: akka-cqrs
  name: graphite-http
  labels:
    app: statsd
spec:
  ports:
    - name: query-http
      port: 8080
      protocol: TCP
      targetPort: 80
  selector:
    app: statsd
  type: LoadBalancer
---
apiVersion: apps/v1beta1
kind: Deployment
metadata:
  namespace: akka-cqrs
  name: statsd
  labels:
    app: statsd
spec:
  replicas: 1
  template:
    metadata:
      labels:
        app: statsd
    spec:
      containers:
      - name: statsd
        image: graphiteapp/graphite-statsd
        ports:
        - containerPort: 80
          protocol: TCP
        - containerPort: 8125
          protocol: UDP
        - containerPort: 8126
          protocol: TCP
        - containerPort: 2003
          protocol: TCP
        - containerPort: 2004
          protocol: TCP
        readinessProbe:
          httpGet:
            path: "/"
            port: 80
          initialDelaySeconds: 5
This will deploy both the Jager and StatsD services to our Kubernetes cluster under the akka-cqrs namespace, like the rest of our services.
We’ll leave it to you to explore what the YAML files do in more detail, but here are the important highlights for this training course:
- Exposes the Jaeger services’ collection endpoints under the
jaeger-agentservice name, which is what we pass into theJAEGER_AGENT_HOSTenvironment variable in all of our services - we will be using the 6831 UDP agent endpoint; - Exposes the Jaeger HTTP UI as a load-balancer under port 8881, so after deployment you can visit the web UI by browsing to http://localhost:8881;
- Exposes the StatsD UDP endpoint under the
statsdservice name and exposes all of its endpoints - we’ll be using the standard 8125 UDP endpoint inside our Phobos driver; - Exposes the Graphite UI for exploring the metrics gathered by StatsD as a load-balancer under port 8080, so after deployment you can visit the web UI by browsing to http://localhost:8080; and
- Deploys all of the StatsD and Jaeger containers needed to run the infrastructure.
kubectl Jaeger and StatsD Deployment
Now that we have our Kubernetes service definition files ready to go, it’s time to deploy them to our cluster. From the root directory of your solution, execute the following two commands:
PS> kubectl apply -f ./k8s/jaeger-all-in-one.yaml
PS> kubectl apply -f ./k8s/statsd-deploy.yaml
Once both of these commands complete, you can check the status of your deployment via the kubectl get all command:
PS> ./deployK8sServices.cmd
PS> kubectl get all -n akka-cqrs
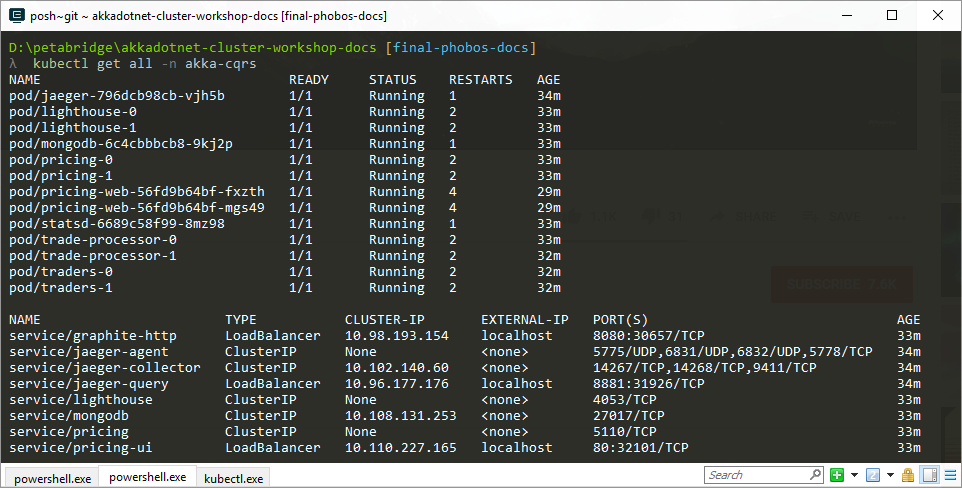
Once you see that both the Jaeger and StatsD containers are in a “ready” state, use your web browser to view their web UIs respectively:
- Jaeger - http://localhost:8881
- StatsD/Graphite - http://localhost:8080
Now that our infrastructure is ready to go, it’s time to rebuild our application to use Phobos!
Compiling with Phobos
Since we’re using Akka.NET and Kubernetes, we should be able to re-deploy our already-running applications without having to take the entire cluster down. That’s exactly what we’re going to do now.
Follow the Akka.CQRS Docker “bump and build” procedure with a new version number - let’s call it 0.2.0 in this case:
NOTE - Please follow Akka.CQRS Docker “bump and build” above before runing this command
PS> ./build.cmd Docker phobos
This will create the following Docker images:
- akka.cqrs.pricing:0.2.0
- akka.cqrs.traders:0.2.0
- akka.cqrs.tradeprocessor:0.2.0
- akka.cqrs.pricing.web:0.2.0
We can then roll these new Docker images out to our Kubernetes cluster via the kubectl set image command:
PS> kubectl -n akka-cqrs set image statefulset/pricing pricing=akka.cqrs.pricing:0.2.0
PS> kubectl -n akka-cqrs set image deployment/pricing-web pricing-web=akka.cqrs.pricing.web:0.2.0
PS> kubectl -n akka-cqrs set image statefulset/traders traders=akka.cqrs.traders:0.2.0
PS> kubectl -n akka-cqrs set image statefulset/trade-processor trade-processor=akka.cqrs.tradeprocessor:0.2.0
If you want to follow along and watch these deployments get rolled out to your cluster in real-time, we recommend that you execute the following Petabridge.Cmd command:
PS> kubectl -n akka-cqrs exec lighthouse-0 pbm 127.0.0.1:9110 cluster tail
The cluster tail command will allow you to track real-time changes to your cluster’s membership and since the Lighthouse nodes aren’t affected by any of these deployments, you’ll receive an unbroken stream of data from these nodes as the deployment occurs.
WARNING: Introducing Phobos into an already running cluster will also introduce some serialization errors at run-time until the rest of the cluster is fully upgraded to also use Phobos. This is because user-defined messages are wrapped inside Phobos envelopes that contain tracing information necessary for us to construct a distributed trace that spans multiple nodes in the cluster.
If you wanted to avoid this issue in a production system, you’d have to do the Phobos deployment in two phases:
Phase 1 - Deploy all of the Phobos binaries with
phobos.tracing.enabled=off. This means that each node gets to be deployed with the Phobs message serializer definitions and binaries loaded into the system, but not actively used during any Akka.Remote communication.Phase 2 - After 100% of nodes in the cluster have been deployed with Phobos binaries enabled and loaded into their HOCON, re-deploy the nodes with
phobos.tracing.enabled=on. That will turn on the tracing system.
The kubectl set image command works the following way - it identifies the resource you want to change (i.e. a deployment, a stateful set) and then it identifies the specific container instance running inside the pod you want to modify (i.e. traders container inside the pods running inside the traders stateful set) and then executes a rolling update to those pods, depending on how you’ve configured them.
Once your deployment has completed, you should start seeing data show up in the Jaeger and StatsD web UIs!
Viewing Phobos Output
When you look at Jaeger, you should see a list of service names that belong to each of the nodes inside your cluster:
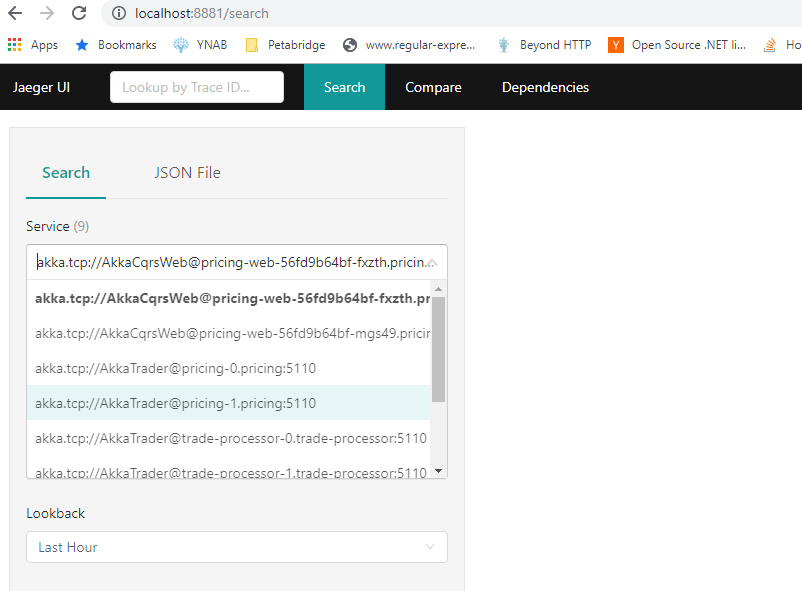
Pick one of the services and then click the Find Traces button - this will show you all of the recorded traces that have had traffic pass through this service during the course of fulfilling a request.
In the screenshot below, we can see one of the Pricing services publish some IVolumeChanged and IPriceChanged events over ClusterClient to the Akka.CQRS.Pricing.Web nodes.
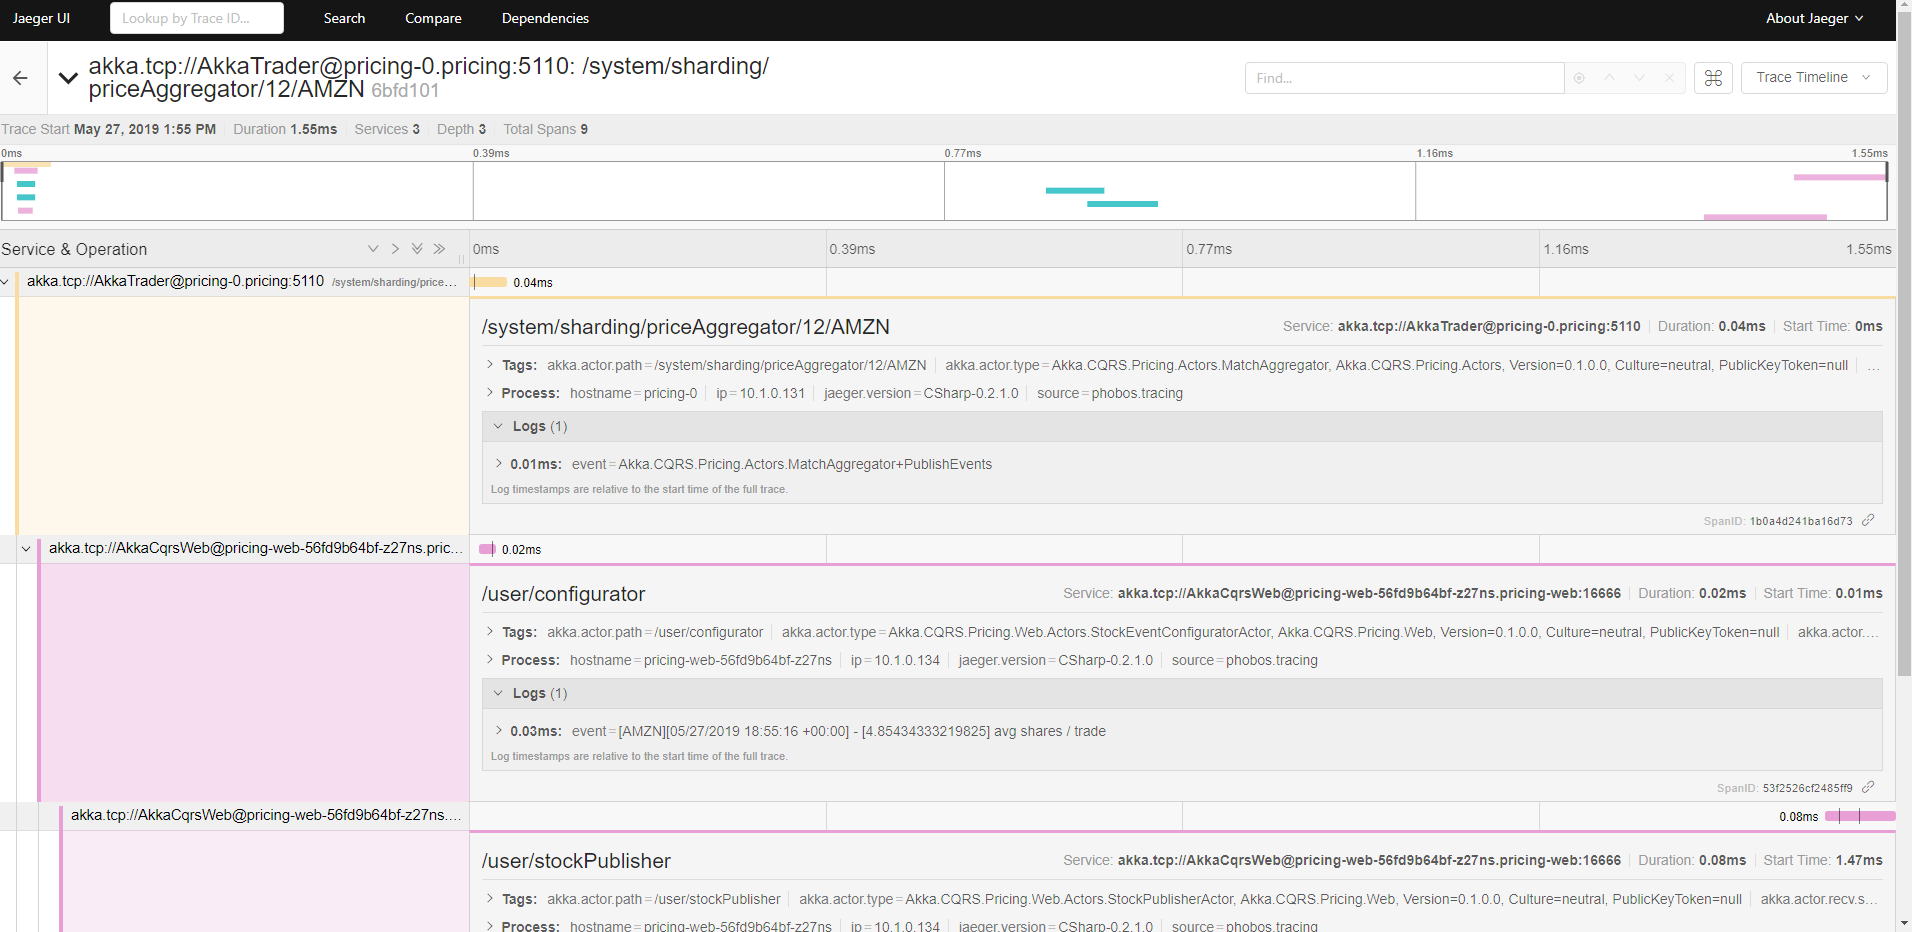
You can inspect each one of the steps on the histogram and see the exact state of the actor and the message it processed at the time, including any log messages captured using the ILoggingAdapter inside your actors.
Play around with the UIs for both Jaeger and Graphite and see what you can learn about your application? For instance, are there any unhandled messages in the Akka.CQRS applications? See if you can find them using Jaeger!
Cleaning Up
To destroy your Kubernetes cluster, invoke the following command:
PS> ./stopK8sServices.cmd
This will completely delete all of the Kubernetes resources in the akka-cqrs namespace.