// BLOG
Phobos 2.10: Game-Changing Akka.NET Cluster Monitoring and Actor Performance Dashboards
Find bottlenecks, sources of error, and track changes to your cluster in real-time.
![]()
Phobos 2.10 is here, and it’s a game-changer for anyone running Akka.NET applications in production. This release doesn’t just incrementally improve observability - it fundamentally transforms how you understand and troubleshoot actor performance in your clusters.
The headline features: accurate backpressure measurement across all actors, a bird’s-eye view of your entire Akka.NET cluster activity, detailed actor performance analysis dashboards, and the ability to easily filter /system and /user actors from each other. But here’s what makes this release special - it’s not just about the new metrics (though those are substantial). It’s about the beautiful, production-ready dashboards that make all this data instantly actionable.
Why This Release Matters
Let me tell you a story. Back in 2014, when we were building MarkedUp Analytics - our real-time app analytics platform that processed hundreds of millions of events per day - we had a problem. Our Akka.NET network1 was performing well most of the time, but during traffic spikes, certain actors would become bottlenecks. We could see the symptoms: response times would climb, memory usage would spike, and occasionally the whole system would grind to a halt.
The problem wasn’t that we lacked monitoring tools. We had plenty of metrics flying around thanks to Akka.Monitoring2. The problem was visibility. We couldn’t easily answer fundamental questions like:
- Which actors are actually under stress right now?
- Where are the real bottlenecks in our message flow?
- How much backpressure are our actors experiencing?
- Is this a
/systemactor problem or a/useractor problem?
Fast-forward to today, and Phobos 2.10 solves every single one of these problems with production-ready dashboards that give you instant clarity on your cluster’s health.
What’s New in Phobos 2.10
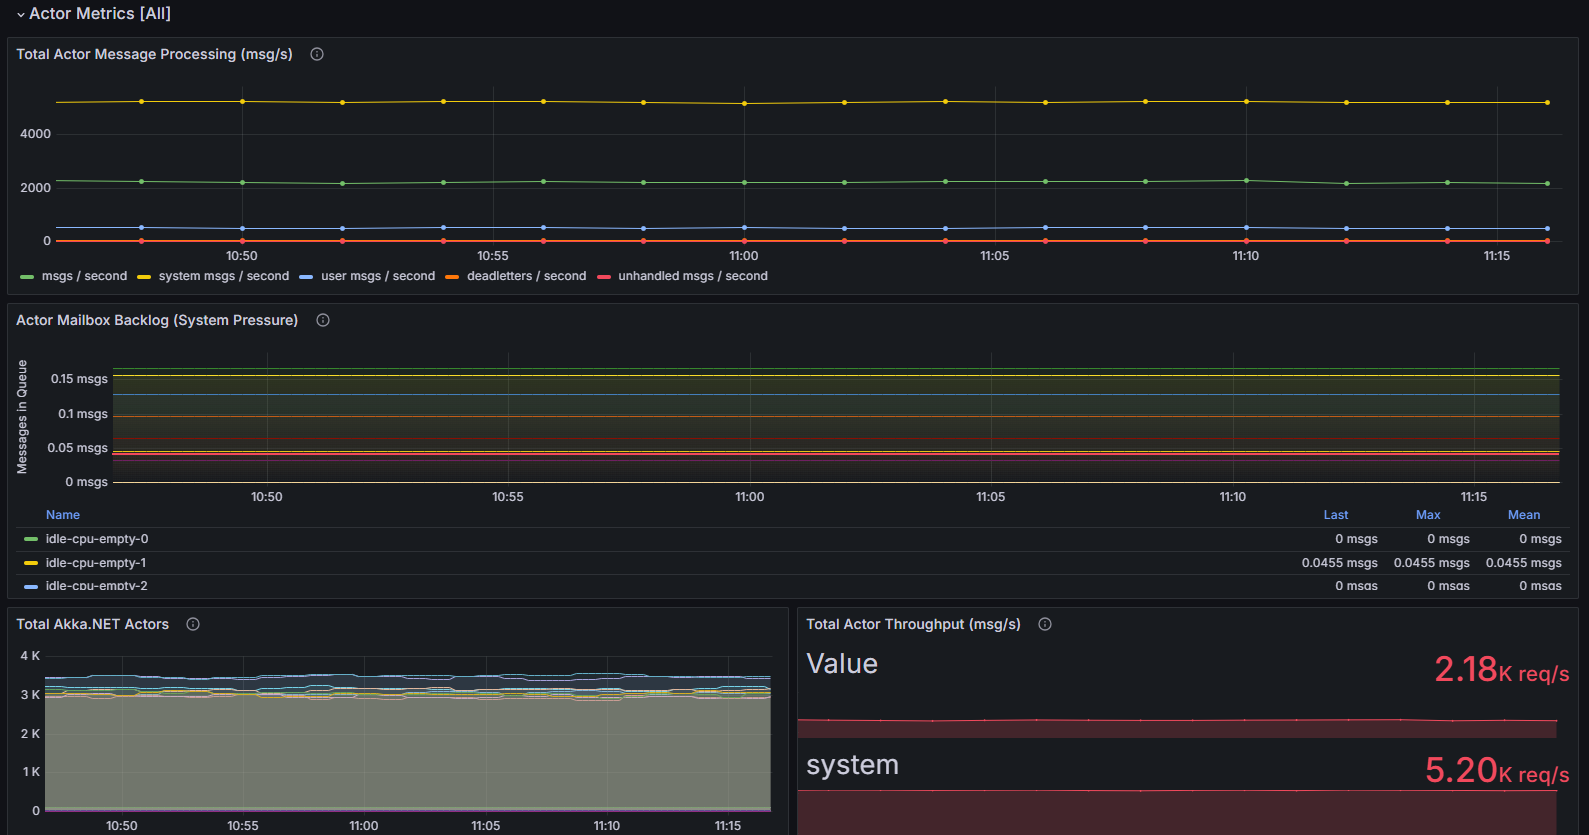
Accurate Backpressure Measurement
For the first time, Phobos can accurately measure backpressure across all your actors. This isn’t just theoretical - you can now see exactly which actors have growing mailboxes, how fast they’re processing messages, and where your bottlenecks actually are.
graph TD
    A[Incoming Messages] --> B[Actor Mailbox]
    B --> C[Message Processing]
    C --> D[Outgoing Messages]
    B -.-> E[Mailbox Depth Metric]
    C -.-> F[Processing Time Metric]
    E --> G[Backpressure Dashboard]
    F --> G
    G --> H[Actionable Insights]
The magic happens in the mailbox depth monitoring. Previous versions of Phobos could tell you about message processing times, but couldn’t easily show you when actors were getting overwhelmed. Now you get real-time visibility into queue depth, processing rates, and throughput - the holy trinity of actor performance monitoring.
Bird’s-Eye Cluster View
The new cluster overview dashboard gives you exactly what the name suggests: a comprehensive view of your entire Akka.NET cluster’s activity.
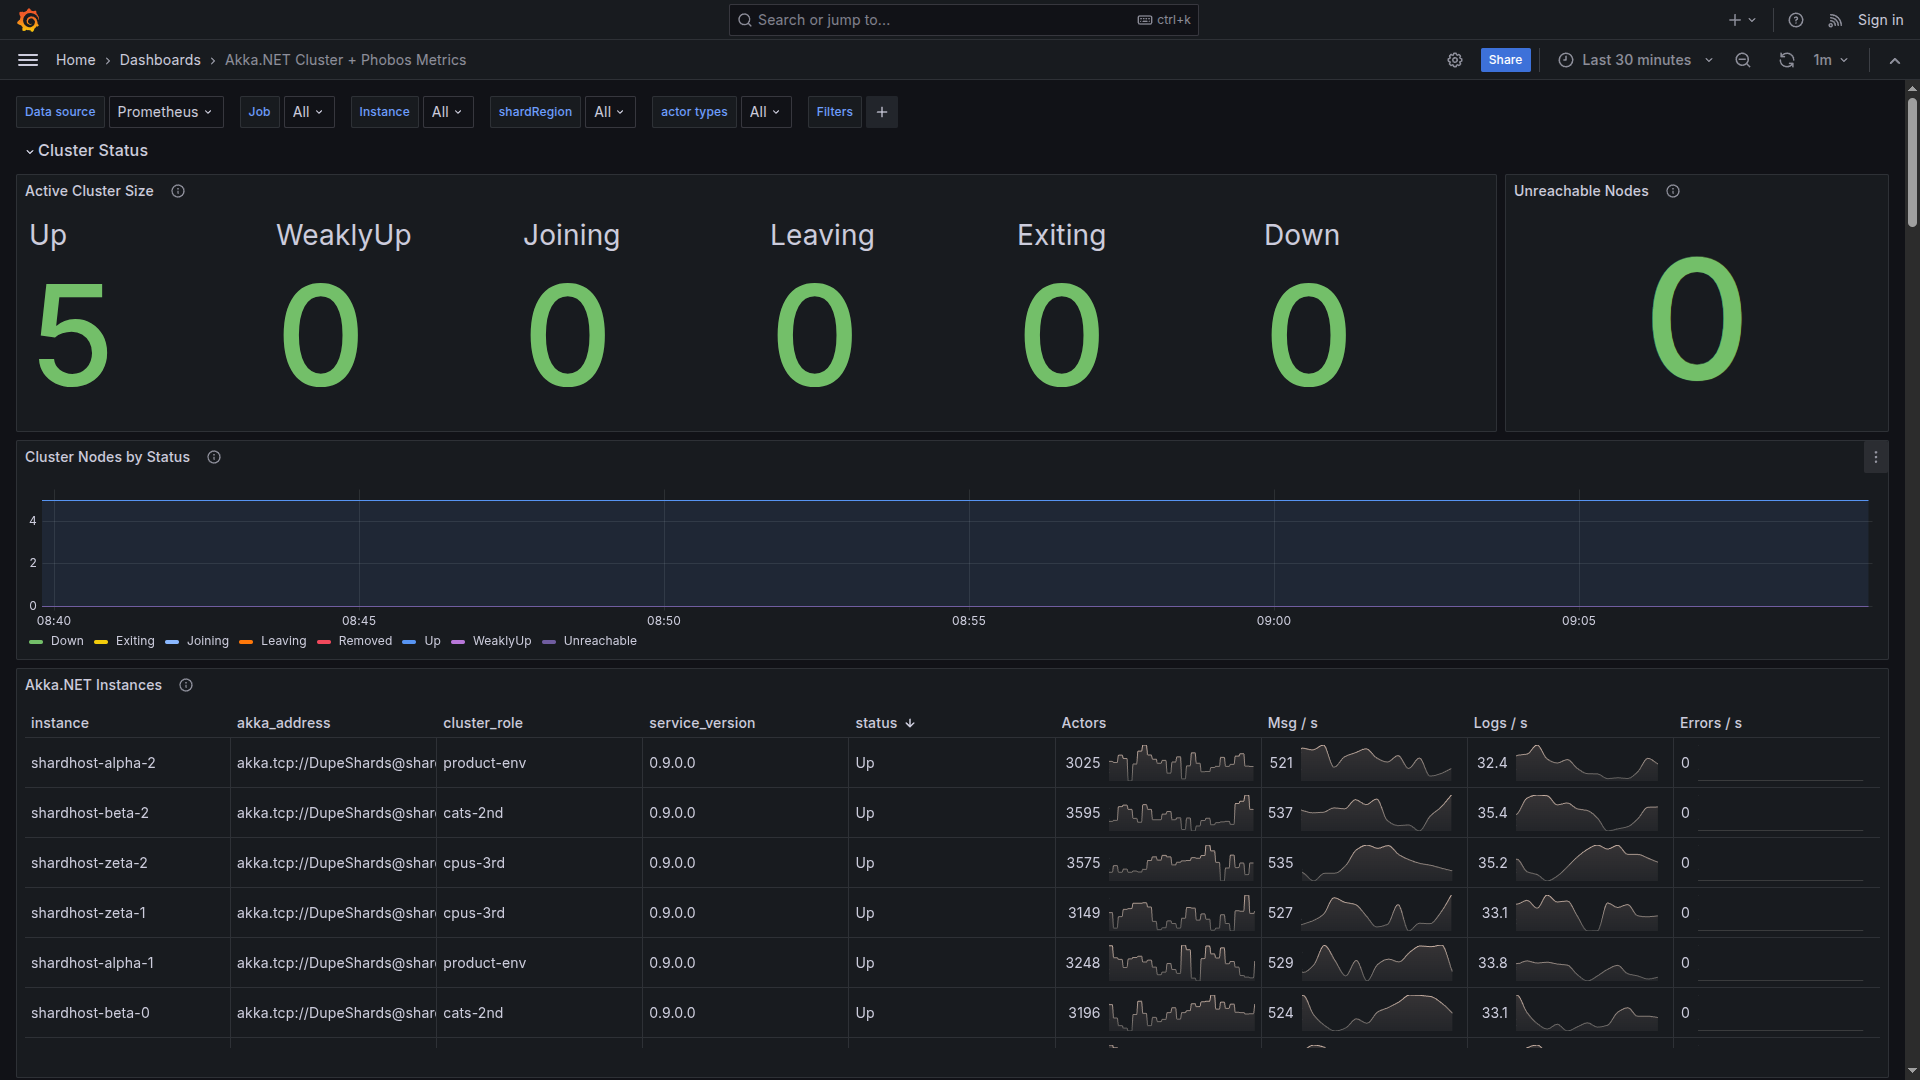
You can see:
- Node health and status across your entire cluster
- Message throughput patterns in real-time
- Memory and CPU utilization per node
- Actor system distribution across nodes
This is the dashboard I wish I had back in the MarkedUp days. Instead of jumping between different monitoring tools and trying to piece together a picture of cluster health, you get everything in one view.
Actor Performance Analysis Dashboard
Here’s where things get really interesting. The new actor performance dashboard breaks down your application’s behavior in ways that were previously impossible.
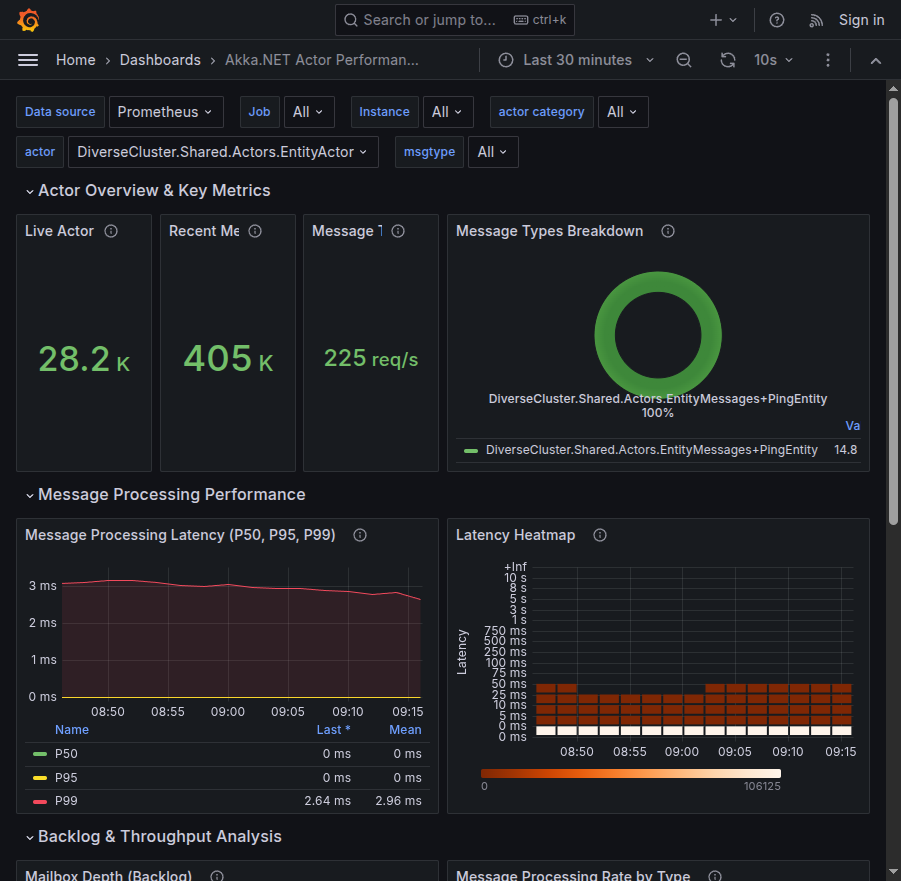
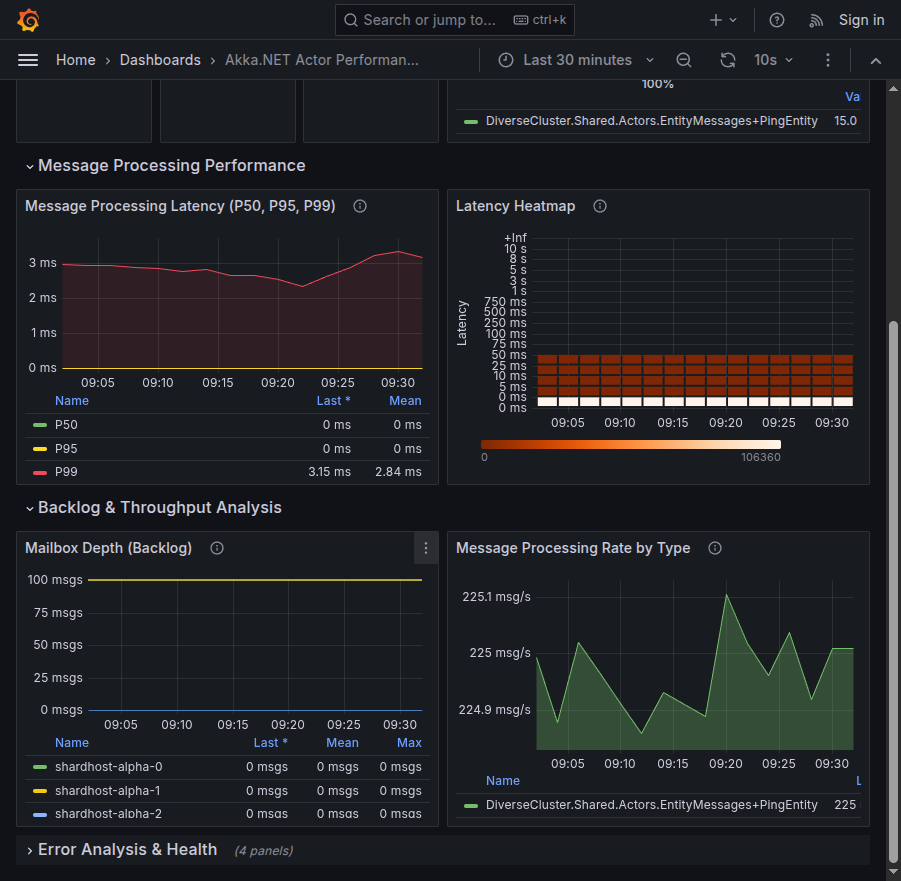
Key capabilities include:
- Message latency analysis with percentile breakdowns
- Actor category filtering (easily separate
/systemfrom/useractors) - Throughput trends over configurable time windows
- Error rate tracking per actor type
The filtering capability alone is worth the upgrade. How many times have you been troubleshooting a performance issue only to realize you were looking at internal /system actor metrics instead of your actual business logic actors? Those days are over.
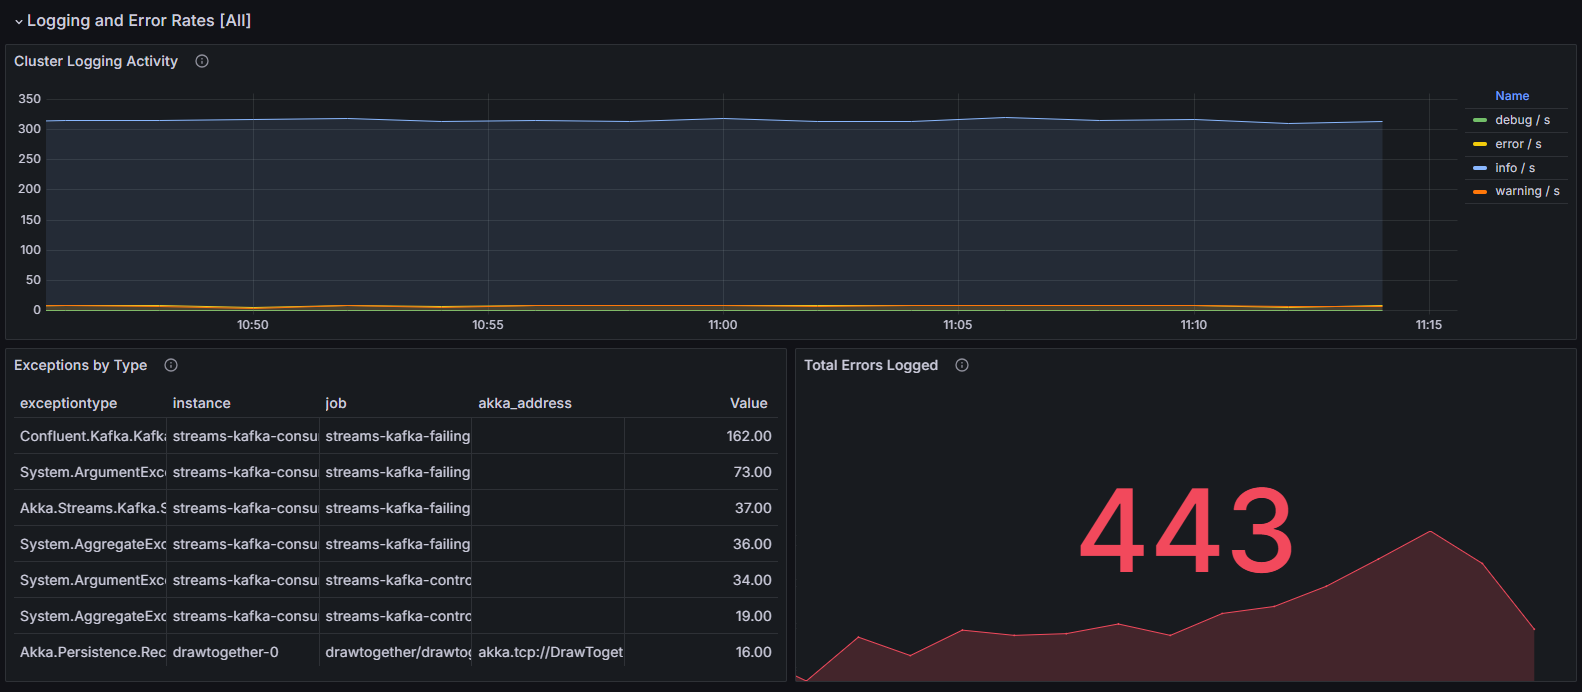
Followers Modern OpenTelemetry Best Practices
This release also modernizes how Phobos integrates with the OpenTelemetry ecosystem. We’ve moved away from custom akka_address labels to using built-in OpenTelemetry service attributes for identifying application instances. This means:
- Better compatibility with standard observability tools
- Cleaner metric namespaces that follow OTEL conventions
- Easier correlation with other OpenTelemetry instrumentation in your stack
If you’re already using OpenTelemetry in your .NET applications (and you should be), Phobos fits seamlessly into that ecosystem.
One-Click Dashboard Installation
The best part? These dashboards are available as one-click installs on Grafana Cloud.
Available dashboards:
- Cluster Overview Dashboard - Your cluster’s vital signs at a glance
- Actor Performance Dashboard - Deep-dive actor performance analysis
No more spending hours building custom dashboards or trying to figure out which metrics actually matter. These dashboards represent years of production experience distilled into immediately actionable visualizations.
Real-World Impact
Let me give you a concrete example of how this changes your troubleshooting workflow.
Before Phobos 2.10:
- Notice application slowdown
- Check overall CPU/memory metrics (inconclusive)
- Dig through application logs (time-consuming)
- Try to correlate timing with various actor behaviors (frustrating)
- Eventually find the bottleneck through trial and error (hours later)
With Phobos 2.10:
- Notice application slowdown
- Open cluster overview dashboard (see which node has highest mailbox backlog)
- Switch to actor performance dashboard (identify specific actor types with high latency / large backlogs)
- Filter out system actors (focus on business logic)
- Identify bottleneck and implement fix (minutes, not hours)
That’s the difference between having metrics and having actionable insights.
Who Should Upgrade
Existing Phobos Customers
If you’re already using Phobos, this is a must-upgrade release. The new dashboards alone will transform how you operate your Akka.NET applications. The enhanced metrics provide deeper visibility than ever before, and the modern OpenTelemetry integration future-proofs your observability stack.
Migration is straightforward - the new metrics are additive, so you won’t lose any existing monitoring capabilities.
Akka.NET Users Without Phobos
If you’re running Akka.NET applications in production without proper observability, you’re flying blind. I’ve seen too many teams struggle with performance issues that could have been diagnosed in minutes with the right tooling.
Phobos 2.10 represents the most comprehensive actor monitoring solution available for Akka.NET. These dashboards give you production-grade observability that would take months to build from scratch.
Teams Evaluating Akka.NET
If you’re considering Akka.NET for a new project, having production-ready monitoring from day one changes the conversation. You’re not just getting a powerful actor framework - you’re getting enterprise-grade observability that scales with your application. Observability isn’t a mere “feature” of Akka.NET - it is literally our business to make sure Phobos meets your needs.
Getting Started
Setting up Phobos 2.10 with the new dashboards is straightforward:
- Upgrade Phobos to version 2.10 in your applications
- Configure OpenTelemetry following our setup guide
- Import the dashboards with one-click installs from Grafana Cloud
- Start monitoring your cluster with unprecedented visibility
The entire setup process takes less than an hour, and you’ll immediately see the benefits in your monitoring workflow.
You can also check out the Phobos QuickStart, which uses .NET Aspire to orchestrate a 3-node Akka.NET cluster along with Prometheus, Grafana, and Seq - all you need are your Phobos credentials to try it out.
Getting Phobos
Phobos 2.10 is available now. Whether you’re upgrading from a previous version or implementing Akka.NET monitoring for the first time, these new capabilities will fundamentally change how you understand your applications in production.
Get Phobos 2.10 and experience what true actor observability looks like.
For existing customers, the upgrade is included in your subscription. For new customers, we offer simple, flat-price licensing regardless of your scale. If you have questions or want to do a Phobos trial, contact us.
The days of guessing what your actors are doing in production are over. With Phobos 2.10, you finally have the visibility you need to build and operate Akka.NET applications with confidence.
Questions about Phobos 2.10 or need help with your Akka.NET monitoring strategy? Reach out to our team - we’ve helped hundreds of organizations implement production-grade Akka.NET observability.
-
This is 2014, so before Akka.Cluster was released! ↩
-
https://github.com/petabridge/akka-monitoring - now archived. I wrote this in an afternoon and the quality shows, but it got the job done back then. ↩
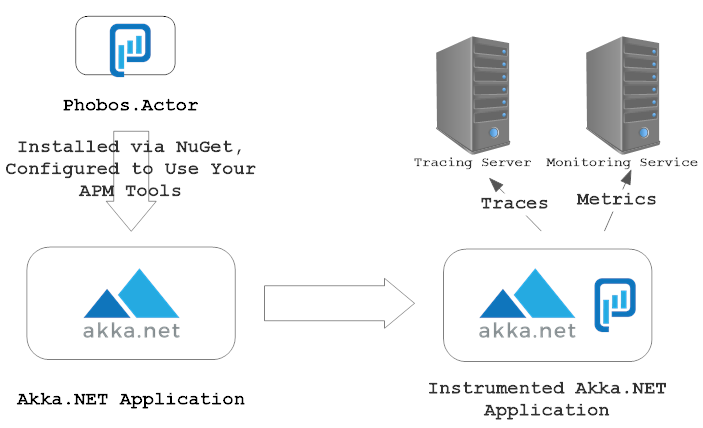
Observe and Monitor Your Akka.NET Applications with Phobos
Phobos automatically instruments your Akka.NET applications with OpenTelemetry — traces, metrics, and logs with built-in dashboards.

Enjoyed this post? Subscribe to our newsletter for more insights on distributed systems, Akka.NET, and .NET + AI.
// COMMENTS