How We Made Phobos 2.4's OpenTelemetry Usage 62% Faster
OpenTelemetry Performance Optimization Practices
Phobos is our observability + monitoring library for Akka.NET and last year we launched Phobos 2.0 which moved our entire implementation onto OpenTelemetry.

One of the issues we’ve had with Phobos: many of our customers build low-latency, real-time applications and adding observability to a software system comes with a noticeable latency + throughput penalty. We were asked by a customer at the beginning of July “is there any way you can make this faster?”
Challenge accepted - and completed.
Earlier this week we shipped Phobos 2.4.0, which is a staggering 62% faster than all of our previous Phobos 2.x implementations - actually Phobos 2.4 is even faster than that for real-world applications and we’ll get to that in a moment.
This blog post is really about optimizing hot-paths for maximum OpenTelemetry tracing and metrics performance and the techniques we used in the course of developing Phobos 2.4.
Let’s dig in.
Historical Benchmark Data
Since we shipped the first version of Phobos back in 2018 we’ve also made “Phobos Performance Impact” data available on our product website - that way users considering purchasing Phobos could set their expectations for how much overhead full Phobos instrumentation (tracing + metrics) adds to their existing user code. This data was generated from a standard NBench macro-benchmark - i.e. live tracing of real actors running in-process.
We mostly use Benchmark.NET for benchmarking our code these days but I find that Benchmark.NET has reproducibility and precision issues with long-running highly concurrent / multi-core macro benchmarks. So for those big benchmarks I still prefer NBench or writing a custom .NET console application to do the measuring for me - as I tend to get results that more closely approximate real-world usage and are fairly reproducible.
We’re also big believers in benchmarking continuity - you should use the same benchmark you’ve been using in order to demonstrate relative improvements or changes in performance. Any changes to that benchmark’s implementation discard historical results - so for both of those reasons we’ve been using the same benchmark to track Phobos’ performance impact for the past five years.
Phobos is a proprietary library so the source code isn’t available but here’s what our primary benchmark looks like:
[PerfBenchmark(
    Description = "Measures the throughput of a fully Phobos instrumented actor",
    RunMode = RunMode.Iterations, NumberOfIterations = 13, TestMode = TestMode.Measurement,
    RunTimeMilliseconds = 1000)]
[CounterMeasurement(MailboxCounterName)]
[GcMeasurement(GcMetric.TotalCollections, GcGeneration.AllGc)]
[MemoryMeasurement(MemoryMetric.TotalBytesAllocated)]
public void Instrumented_Throughput(BenchmarkContext context)
{
    for (var i = 0; i < MailboxMessageCount;)
    {
        _fullyInstrumentedActor.Tell(dataExample);
        _fullyInstrumentedActor.Tell(intExample);
        _fullyInstrumentedActor.Tell(stringExample);
        ++i;
    }

    _mailboxThroughput.Increment(_fullyInstrumentedActor.Ask<int>(Collect.Instance, TimeSpan.FromSeconds(90))
        .Result);
}
We’re measuring the cumulative throughput of a single actor processing 3_000_000 messages, a third of which are a real type, a third of which are a value type, and a third of which are a simple string - so a blend of different potential messages to trace and monitor.
All benchmark figures in this article were gathered from my Intel NUC 12 Pro with the following specs:
BenchmarkDotNet v0.13.6, Windows 11 (10.0.22621.1992/22H2/2022Update/SunValley2)
12th Gen Intel Core i7-1260P, 1 CPU, 16 logical and 12 physical cores
.NET SDK 7.0.302
  [Host]     : .NET 7.0.5 (7.0.523.17405), X64 RyuJIT AVX2
  DefaultJob : .NET 7.0.5 (7.0.523.17405), X64 RyuJIT AVX2
I should also point out that none of these benchmarks were recorded with .NET 7’s Dynamic PGO enabled, which would cause these numbers to improve even more.
Phobos 2.3.1 Performance
Here is our performance as of Phobos 2.3.1, measured in terms of number of messages per second a single actor can process while various tracing / monitoring settings are enabled or disabled:
| Benchmark | Max (r/s) | Average (r/s) | Min (r/s) | StdDev (r/s) |
|---|---|---|---|---|
| Tracing+Metrics | 1,263,278 | 1,145,856 | 1,088,398 | 70,099 |
| Tracing | 1,952,431 | 1,871,857 | 1,715,370 | 76,396 |
| Metrics | 2,670,549 | 2,585,137 | 2,519,923 | 46,618 |
| Uninstrumented | 5,870,611 | 5,651,058 | 5,356,407 | 145,742 |
Our baseline is our “uninstrumented throughput” - that’s the number of messages per second a single Akka.NET actor can process when Phobos is installed (which adds some overhead on top of Akka.NET) but not actually enabled.
Our target is to improve our fully instrumented “Tracing + Metrics” number - which is when Phobos is capturing the most possible information and is also the most resource intensive. You can also see via these initial numbers that tracing is demonstrably more expensive than monitoring.
Profiling
Phobos does a lot of things under the covers: automatically creates relevant spans and metrics, filters out irrelevant ones, injects telemetry behind the scenes of each Akka.NET actor, and uses a configuration system to help fine-tune where telemetry is needed and where it’s not.
Most of Phobos’s value comes from being able to capture all of this data automatically without any real instrumentation needed on the part of the end-user - however, that automation comes with a cost: Phobos has to sit in the middle of the messaging hot-path and record traces + metrics, which is going to inevitably impact application performance. Every OpenTelemetry instrumentation library has this issue including ASP.NET and others.
To understand where to begin our optimization we need to profile the hotpath and see where the CPU is busiest - we use JetBrain’s dotTrace integration in Rider for this.
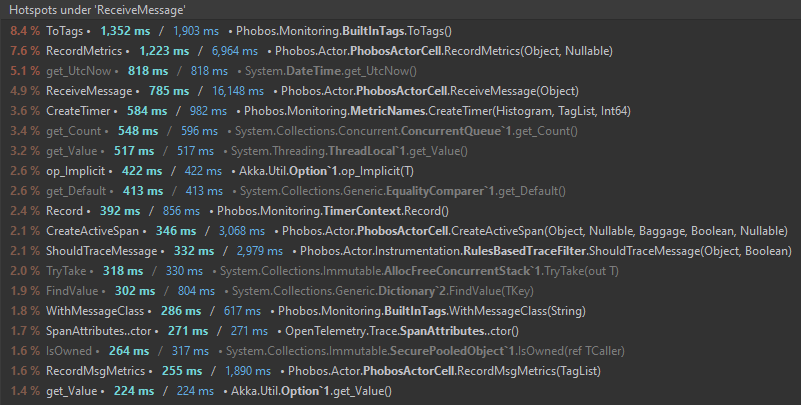
Not what I expected - according to the CPU profiler, it’s our OpenTelemetry metrics API calls that are the biggest resource hogs… Even though the tracing system is demonstrably, significantly slower in our benchmark? Ok - we’ll optimize those first and retest.
OpenTelemetry.Metrics Optimization
Two OpenTelemetry.Metrics optimizations we’ve used from the very beginning of Phobos 2.0:
- Use “bound” metrics - store all of your
Counters,Histograms, et al as singletons and re-use them constantly. This avoids the overhead of having to constantly create and dispose frequently used metric objects. - Use
TagListto pass in metric dimensions -System.Diagnostics.TagListis astructthat allows you to store up to 8KeyValuePair<string,object>“tags” that you can use on any given metric instance. In Phobos it’s how we record dimensions like “which actor type processed this message” or “which type of message was processed?” - and this data can, in turn, be aggregated into dashboards on platforms like Grafana to visualize actor message throughput by actor type / message type.
The TagList data structure is very cleverly designed to prevent list or array allocations (as long as you don’t exceed 8 tags) - and has been heavily performance-optimized by Microsoft already.
Based on our profiling data though - the way we were creating tags was quite expensive. How could that be?
Optimizing TagList Creation & Propagation
Our call sites managing actor message-processing metrics looks like this:
private Option<TimerContext> RecordMetrics(object message, long? latencyStart = null)
{
    var timer = Option<TimerContext>.None;
    if (InstrumentationSettings.Monitor)
    {
        var metricTags = MetricTags.WithMessageClass(message.GetType().ToCleanName()).ToTags(); // high perf impact

        timer = Metrics.MessageReceiveLatency.CreateTimer(metricTags,
            latencyStart ?? TimestampHelper.GetTimestamp());

        RecordMsgMetrics(metricTags);
    }

    return timer;
}

private void RecordMsgMetrics(TagList metricTags)
{
    Metrics.MsgsReceived.Add(1, metricTags);

    // record mailbox depth if it's configured
    if (InstrumentationSettings.MonitorMailbox)
    {
        Metrics.MailboxDepth.Record(Mailbox.MessageQueue.Count, MetricTags.ToTags());
    }
}
The line that was getting us into trouble was the .ToTags() call, which produces a brand new TagList each time it’s called:
public TagList ToTags()
{
    var tagList = new TagList();

    if (RoleTag.HasValue)
    {
        tagList.Add(RoleTag.Value);
    }

    if (AddressTag.HasValue)
    {
        tagList.Add(AddressTag.Value);
    }

    if (ActorClassTag.HasValue)
    {
        tagList.Add(ActorClassTag.Value);
    }

    if (MessageTypeTag.HasValue)
    {
        tagList.Add(MessageTypeTag.Value);
    }

    return tagList;
}
Why is this so expensive? As it turns out I made some fundamental attribution errors about how TagLists can be shared safely across many concurrent invocations of a Metric.Record call:
TagListis astructand therefore it follows copy-on-write semantics: there’s no need for me to worry about mutability across multiple asynchronous method calls - I don’t need to create a newTagListevery time;- Because of those same
copy-on-writesemantics - passing the samestructacross multiple methods results in unnecessary copying within the stack.
These are both very fixable problems, but first - let’s measure the impact of mis-using TagList in 2.3.1:
| Method | Mean | Error | StdDev | Allocated |
|---|---|---|---|---|
| ToTagsWithActorClass | 42.64 ns | 0.853 ns | 0.798 ns | - |
| ToTagsWithActorClassAndMessageType | 50.30 ns | 0.974 ns | 1.082 ns | - |
50ns is pretty high, considering we’re not even allocating any memory on the heap. I wonder what the aggregate impact is on the component that calls RecordMetrics?
| Method | Iterations | MonitoringEnabled | TracingEnabled | Mean | Error | StdDev | Req/sec | Gen0 | Allocated |
|---|---|---|---|---|---|---|---|---|---|
| ReceiveMessageWithoutTrace | 10000 | False | False | 69.37 ns | 1.092 ns | 0.912 ns | 14,414,490.04 | - | - |
| ReceiveMessageWithTrace | 10000 | False | False | 84.40 ns | 1.723 ns | 1.611 ns | 11,848,659.18 | - | - |
| ReceiveMessageWithoutTrace | 10000 | False | True | 324.63 ns | 6.237 ns | 7.183 ns | 3,080,409.80 | 0.0243 | 232 B |
| ReceiveMessageWithTrace | 10000 | False | True | 319.70 ns | 5.974 ns | 5.588 ns | 3,127,930.86 | 0.0243 | 232 B |
| ReceiveMessageWithoutTrace | 10000 | True | False | 226.81 ns | 4.211 ns | 3.733 ns | 4,408,952.03 | - | - |
| ReceiveMessageWithTrace | 10000 | True | False | 228.39 ns | 4.402 ns | 5.567 ns | 4,378,517.17 | - | - |
| ReceiveMessageWithoutTrace | 10000 | True | True | 499.49 ns | 9.815 ns | 10.909 ns | 2,002,030.55 | 0.0238 | 232 B |
| ReceiveMessageWithTrace | 10000 | True | True | 463.39 ns | 8.739 ns | 8.174 ns | 2,158,032.08 | 0.0243 | 232 B |
When just metrics are enabled the entire operation takes roughly 228.4ns - so ToTags is taking up roughly 1/5th of that time.
How to fix this? First, you’ll notice that all of the built-in System.Diagnostics.Instrument<T> (counters, histograms, et al implement this class) methods look like this:
public void Add(T delta, in TagList tagList) => RecordMeasurement(delta, in tagList); // notice the `in` keyword
To eliminate all of the unnecessary copying of the TagList we can do what OTEL metrics does and decorate our methods that consume TagLists to also use the in keyword:
private void RecordMsgMetrics(in TagList metricTags)
{
    Metrics.MsgsReceived.Add(1, metricTags);

    // record mailbox depth if it's configured
    if (InstrumentationSettings.MonitorMailbox)
    {
        Metrics.MailboxDepth.Record(Mailbox.MessageQueue.Count, metricTags);
    }
}
That eliminates 1 unnecessary round of copying right there. Low-hanging fruit. But what about the unnecessary creation of a new TagList every single time?
public BuiltInTags(Option<KeyValuePair<string, object>> roleTag,
    Option<KeyValuePair<string, object>> addressTag,
	Option<KeyValuePair<string, object>> actorClassTag)
{
    RoleTag = roleTag;
    AddressTag = addressTag;
    ActorClassTag = actorClassTag;

    var tags = new TagList();

    if(AddressTag.HasValue)
        tags.Add(AddressTag.Value);
    if(RoleTag.HasValue)
        tags.Add(RoleTag.Value);
    if(ActorClassTag.HasValue)
        tags.Add(ActorClassTag.Value);

    Tags = tags;
}
private TagList Tags { get; }

public TagList WithMessageClass(string messageClassName)
{
    var messageTypeTag = new KeyValuePair<string, object>(MessageTypeLabel, messageClassName);
    var tags = ToTags();
    tags.Add(messageTypeTag);
    return tags;
}
Now we’re making struct’s copy-on-write semantics work for us - we don’t allocate new TagLists on-demand anymore: returning the TagList from the ToTags() method automatically creates a new copy for us and we don’t have to worry about mutability when passing this TagList into all of our subsequent calls!
What’s the performance impact?
| Method | Mean | Error | StdDev | Req/sec | Allocated |
|---|---|---|---|---|---|
| ToTagsWithActorClass | 24.17 ns | 0.384 ns | 0.360 ns | 41,365,333.48 | - |
| ToTagsWithActorClassAndMessageType | 30.66 ns | 0.633 ns | 0.528 ns | 32,616,520.86 | - |
From 50ns to 30s - that’s a 40% improvement! Not bad for a little struct shuffling.
So what’s the aggregate improvement look like in Phobos’ metrics processing?
| Method | Iterations | MonitoringEnabled | TracingEnabled | MessageKind | Mean | Error | StdDev | Req/sec | Gen0 | Allocated |
|---|---|---|---|---|---|---|---|---|---|---|
| ReceiveMessageWithoutTrace | 10000 | True | False | Primitive | 152.27 ns | 2.953 ns | 3.282 ns | 6,567,116.76 | - | - |
| ReceiveMessageWithTrace | 10000 | True | False | Primitive | 148.97 ns | 2.987 ns | 2.933 ns | 6,712,556.62 | - | - |
| ReceiveMessageWithoutTrace | 10000 | True | False | Class | 149.32 ns | 2.871 ns | 2.685 ns | 6,696,818.83 | - | - |
| ReceiveMessageWithTrace | 10000 | True | False | Class | 150.60 ns | 3.000 ns | 2.946 ns | 6,640,183.19 | - | - |
| ReceiveMessageWithoutTrace | 10000 | True | False | Record | 153.54 ns | 2.762 ns | 2.584 ns | 6,513,013.88 | - | - |
| ReceiveMessageWithTrace | 10000 | True | False | Record | 150.68 ns | 2.945 ns | 2.755 ns | 6,636,731.49 | - | - |
We went from ~225ns to ~150ns in most cases, a 33% improvement! That aggregate improvement was the result of some other non-OTel changes too (i.e. avoiding copying of other types of structs just like the TagList; caching frequently-used strings) but it all stems from the same place: in tight loops that are frequently executed, you still have to be careful about stack allocations - use the in parameter generously.
OpenTelemetry.Tracing Optimizations
While our profiler showed that metrics calls that consumed the most CPU, we knew that this was misleading - and that’s part of the balancing act of performance management: data is contextual.
Tracing is demonstrably more expensive than metrics because it’s significantly more resource-intensive:
- Requires explicit propagation of
TelemetrySpans /SpanContext/Baggagebetween local and remote calls; - Stringification of important contextual data, such as logs / attributes / and events; and
- Always requires actual heap allocations that have to be GCed whereas OpenTelemetry.Metrics can be done with zero allocations.
So why didn’t our CPU profiling show that trace methods were generally more expensive? This is because most of the expense was tied up by object allocations and garbage collection - which don’t show up as easily identifiable user-method-calls in the profiler.
NOTE: if you want to learn more about this type of subject matter, please see my talk on “.NET Systems Programming Learned the Hard Way.”
Given that important systems programming context we need to:
- Defer allocations so they happen outside the hotpath (i.e. occur inside the OpenTelemetry processing pipeline instead) or
- Prevent allocations from happening if they are not necessary.
Both of these changes improve performance around the hot-path - what does that look like in Phobos 2.3.1?
private TelemetrySpan CreateActiveSpan(object underlyingMsg, SpanContext? context = null,
    Baggage baggage = default, bool followFromActiveSpan = true, long? startTimeUtcTicks = null)
{
    CompleteLifespanScope();

    var startTime = startTimeUtcTicks != null
        ? new DateTimeOffset(startTimeUtcTicks.Value, TimeSpan.Zero)
        : DateTimeOffset.UtcNow;

    TelemetrySpan sp = null;
    if (context == null)
    {
        sp = Tracer.StartRootSpan(underlyingMsg.GetType().GetOperationName(),
            SpanKind.Consumer, InitialAttributes, startTime: startTime);

        Tracer.WithSpan(sp); // mark the current span as active
    }
    else
    {
        sp = Tracer.StartActiveSpan(underlyingMsg.GetType().GetOperationName(),
            SpanKind.Consumer, parentContext: context.Value, InitialAttributes, startTime: startTime);
    }

    // Restore the stored baggage
    Baggage.Current = baggage;
    sp.SetAttribute(MsgSenderTagName, (Sender ?? ActorRefs.Nobody).Path.ToStringWithAddress())
        .SetAttribute(MessageTagName, underlyingMsg.GetType().ToCleanName());

    // Added to resolve https://github.com/petabridge/phobos-issues/issues/59
    if (!InstrumentationSettings.LogMessageEvents) return sp;
    if (startTimeUtcTicks != null)
    {
        sp.AddEvent("waiting", startTime);
    }
    var attributes = new SpanAttributes();
    attributes.Add("content", underlyingMsg.ToString());
    sp.AddEvent("message", attributes);

    return sp;
}
Where do allocations occur inside this method?
- Creating the original
TelemeterySpanin theTracer.StartRootSpanorTracer.StartActiveSpanmethod - there’s nothing we can do to prevent this as it’s required for tracing. - Both of the
SetAttributecalls involve two allocations each: expanding the attributes collection size internally AND the “stringification” of the data type. - The final
AddEventcall - includes the creation of a newSpanAttributesobject and theunderlyingMsg.ToString()call.
Deferred string-ification
We made some major performance optimizations on Akka.NET v1.5 around deferring stringification of logging messages - given that, eliminating the underlyingMsg.ToString() seemed like the best target.
Some relevant numbers from our CreateActiveSpan benchmark for different types of messages an actor might process:
| Method | MessageKind | Mean | Error | StdDev | Req/sec | Gen0 | Allocated |
|---|---|---|---|---|---|---|---|
| CreateNewRootSpan | Primitive | 119.1 ns | 2.17 ns | 2.03 ns | 8,399,591.08 | 0.0246 | 232 B |
| CreateChildSpan | Primitive | 123.8 ns | 2.47 ns | 2.42 ns | 8,076,859.69 | 0.0246 | 232 B |
| CreateChildSpanWithBaggage | Primitive | 122.3 ns | 2.18 ns | 2.04 ns | 8,179,444.13 | 0.0246 | 232 B |
| CreateNewRootSpan | Class | 164.4 ns | 2.80 ns | 2.62 ns | 6,081,681.47 | 0.0348 | 328 B |
| CreateChildSpan | Class | 170.2 ns | 1.94 ns | 1.72 ns | 5,873,753.13 | 0.0348 | 328 B |
| CreateChildSpanWithBaggage | Class | 169.6 ns | 3.17 ns | 2.97 ns | 5,896,706.30 | 0.0348 | 328 B |
| CreateNewRootSpan | Record | 222.3 ns | 4.48 ns | 5.50 ns | 4,497,668.25 | 0.0730 | 688 B |
| CreateChildSpan | Record | 222.9 ns | 4.27 ns | 4.75 ns | 4,485,591.41 | 0.0730 | 688 B |
| CreateChildSpanWithBaggage | Record | 226.7 ns | 2.80 ns | 2.48 ns | 4,411,065.79 | 0.0730 | 688 B |
Memory allocation AND observed latency scale with the type of message! This confirms what we already suspected - underlyingMsg.ToString() is the biggest resource hog. C# records have notoriously slow ToString methods because they use a StringBuilder to pretty-print all of the child members internally. By constrast - our class type just uses simple string interpolation in an overridden ToString() implementation and is significantly faster.
If we can defer this expensive .ToString() invocation so it happens outside of the hotpath that would be an enormous win for all Phobos users. How could we accomplish this?
As it turns out - there’s support for performing this type of “deferring stringification” in System.Diagnostics.Activity, the base class library upon which .NET’s OpenTelemetry.Trace APIs are built!
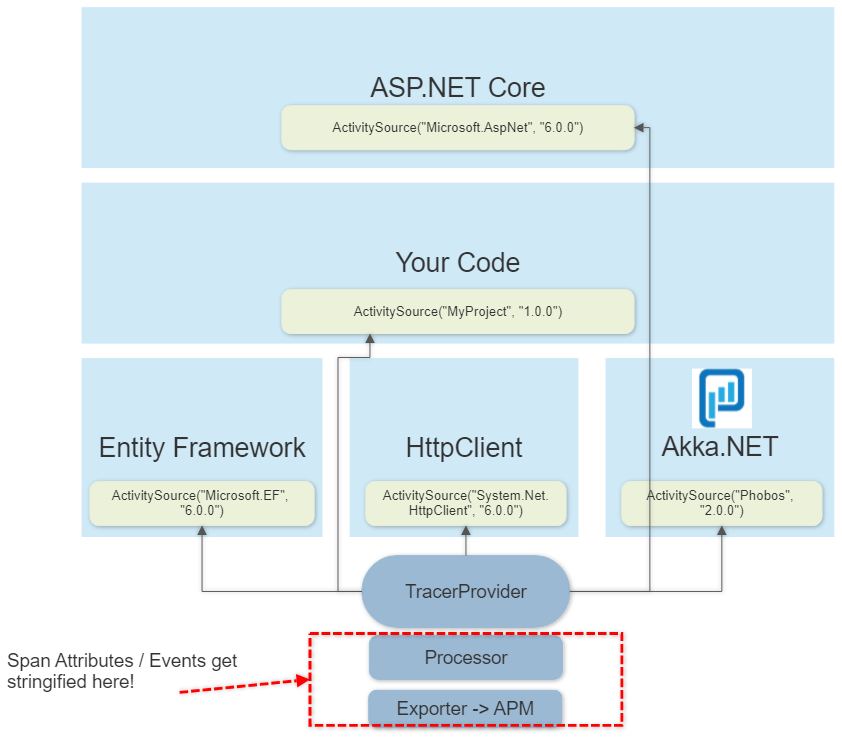
If you avoid converting things to strings in your hot-path, the OTel processor + exporter pipeline will do it automatically during trace export - this can move expensive allocations from performance-sensitive areas of your application to the out-of-band processing OpenTelemetry does anyway without any data loss.
So how to do that with the TelemetrySpan and SpanAttributes?
// rest of  CreateActiveSpan method
static IEnumerable<KeyValuePair<string, object>> CreateSpanAttributes(object msg)
{
    yield return new KeyValuePair<string, object>("content", msg);
}

var attributes = new SpanAttributes(CreateSpanAttributes(underlyingMsg));
sp.AddEvent("message", attributes);

return sp;
Unfortunately there’s no SpanAttributes.SetAttribute(string,object) method available in OpenTelemetry as of 1.5.1, although I submitted a pull request to add one here](https://github.com/open-telemetry/opentelemetry-dotnet/pull/4672). Therefore - in order to defer string-ification you have to pass an IEnumerable<KeyValuePair<string,object>> into the SpanAttributes constructor, which we did here using a static local function.
So what’s the impact?
| Method | MessageKind | Mean | Error | StdDev | Req/sec | Gen0 | Allocated |
|---|---|---|---|---|---|---|---|
| CreateNewRootSpan | Primitive | 152.0 ns | 2.58 ns | 2.42 ns | 6,580,292.48 | 0.0322 | 304 B |
| CreateChildSpan | Primitive | 149.7 ns | 1.98 ns | 1.85 ns | 6,681,595.57 | 0.0322 | 304 B |
| CreateChildSpanWithBaggage | Primitive | 150.3 ns | 2.71 ns | 2.53 ns | 6,653,843.06 | 0.0322 | 304 B |
| CreateNewRootSpan | Class | 150.1 ns | 2.74 ns | 2.29 ns | 6,660,638.95 | 0.0322 | 304 B |
| CreateChildSpan | Class | 149.1 ns | 2.38 ns | 2.11 ns | 6,704,915.73 | 0.0322 | 304 B |
| CreateChildSpanWithBaggage | Class | 151.2 ns | 2.87 ns | 2.69 ns | 6,613,827.37 | 0.0322 | 304 B |
| CreateNewRootSpan | Record | 147.8 ns | 2.80 ns | 2.62 ns | 6,766,604.10 | 0.0322 | 304 B |
| CreateChildSpan | Record | 147.0 ns | 2.75 ns | 2.57 ns | 6,801,670.75 | 0.0322 | 304 B |
| CreateChildSpanWithBaggage | Record | 149.7 ns | 2.87 ns | 2.95 ns | 6,678,899.59 | 0.0322 | 304 B |
The performance for tracing primitive data types, such as string, became slightly worse (120ns to ~150ns) and allocates slightly more memory (304B instead of 232B) - but all of the other test cases perform exactly the same now, meaning that this change was absolutely effective.
Creating a TelemetrySpan for a record now takes only 150ns instead of 225ns, a 33% improvment. We also use 56% less memory than we did before to boot.
Other Notable Performance Mentions
Some other notable mentions for improving performance around OpenTelemetry:
- For complex value (
struct) types likeSpanContextorDateTimeOffset- you’re better off passing around aSpanContext? c = nullfor optional parameters than doing aSpanContext c = default. The reason for this is that the value-based comparison is significantly slower than the reference-based comparison (anullcheck) when checking to see if this value was specified by the caller or not. - Be careful with
Baggagemethod calls - even simple calls likeBaggage.ClearBaggage()allocatestructseach time you call them. Use these methods only when absolutely necessary. - For other areas where
string-ification is necessary AND the data has low cardinality (repeats often), use caching to re-use those same strings over and over again.
Final Results
There were other non-OpenTelemetry fixes we made to Phobos 2.4’s performance as well, such as improvements to our trace filtering system, but the OTEL methods themselves comprised the lion’s share. So what were our final results?
| Benchmark | Max (r/s) | Average (r/s) | Min (r/s) | StdDev (r/s) |
|---|---|---|---|---|
| Tracing+Metrics | 1,911,285 | 1,879,102 | 1,837,075 | 22,929 |
| Tracing | 2,470,909 | 2,418,495 | 2,374,342 | 28,270 |
| Metrics | 4,051,242 | 3,945,305 | 3,873,390 | 49,505 |
| Uninstrumented | 6,979,419 | 6,117,389 | 5,739,619 | 370,057 |
Our uninstrumented throughput in 2.3.1 was 5,651,058 r/s (requests per second) and is now 6,117,389 r/s, so even that was about ~10% faster!
But the fully instrumented throughput, tracing + metrics, is what we care about:
- 2.3.1: 1,145,856 r/s
- 2.4.0: 1,879,102 r/s
An improvement of roughly ~62%! Excellent! All in all this took about 20 hours of work to do - well worth it for our customers and for ourselves.
At the beginning of this article we mentioned:
Phobos 2.4.0, which is a staggering 62% faster than all of our previous Phobos 2.x implementations - actually Phobos 2.4 is even faster than that for real-world applications, but we’ll get to that in a moment.
Reason why I mentioned that: our benchmark is historically 66% primitive types / 33% user-defined classes. Those 66% primitive types used to benchmark significantly faster than classes due to the aforementioned string-ification - now they all run at the same rate. User applications, on the other hand, are typically 100% user-defined classes - therefore our benchmark doesn’t fully capture how much faster Phobos 2.4. runs for them! Even better!
If you have any questions, please leave them in the comments!
If you liked this post, you can share it with your followers or follow us on Twitter!
- Read more about:
- Akka.NET
- Case Studies
- Videos
Observe and Monitor Your Akka.NET Applications with Phobos
Did you know that Phobos can automatically instrument your Akka.NET applications with OpenTelemetry?
Click here to learn more.